About
After observation and/or sub-observation data is accepted into the database, these data are available for graphical visualization and execution of calculations.
Data Visualization
- Select the graph icon.
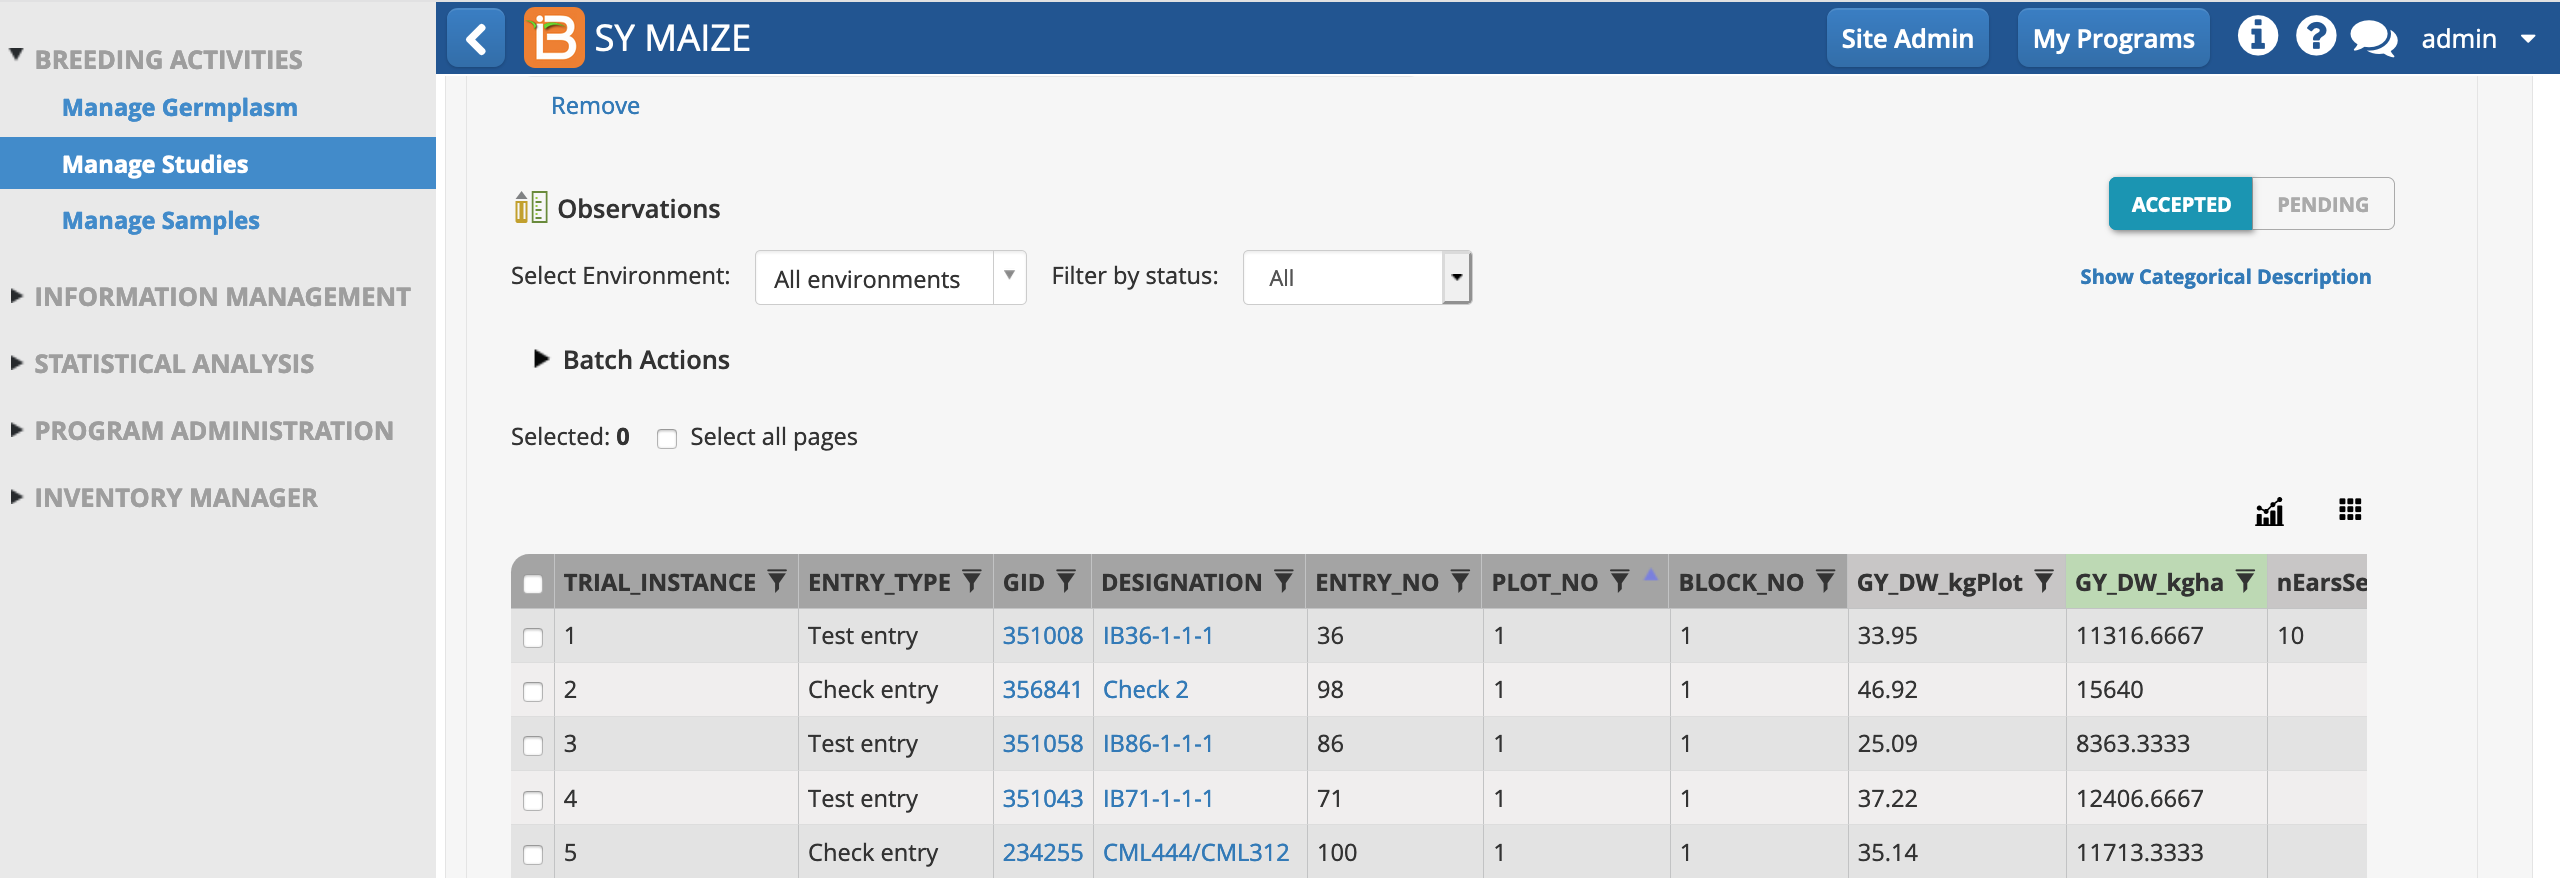
- Choose the type of graph (plot): scatter plot, histogram, box plot.

Scatterplot
- Choose scatterplot, regression method, and dependent variables for the x and y axes. Generate.

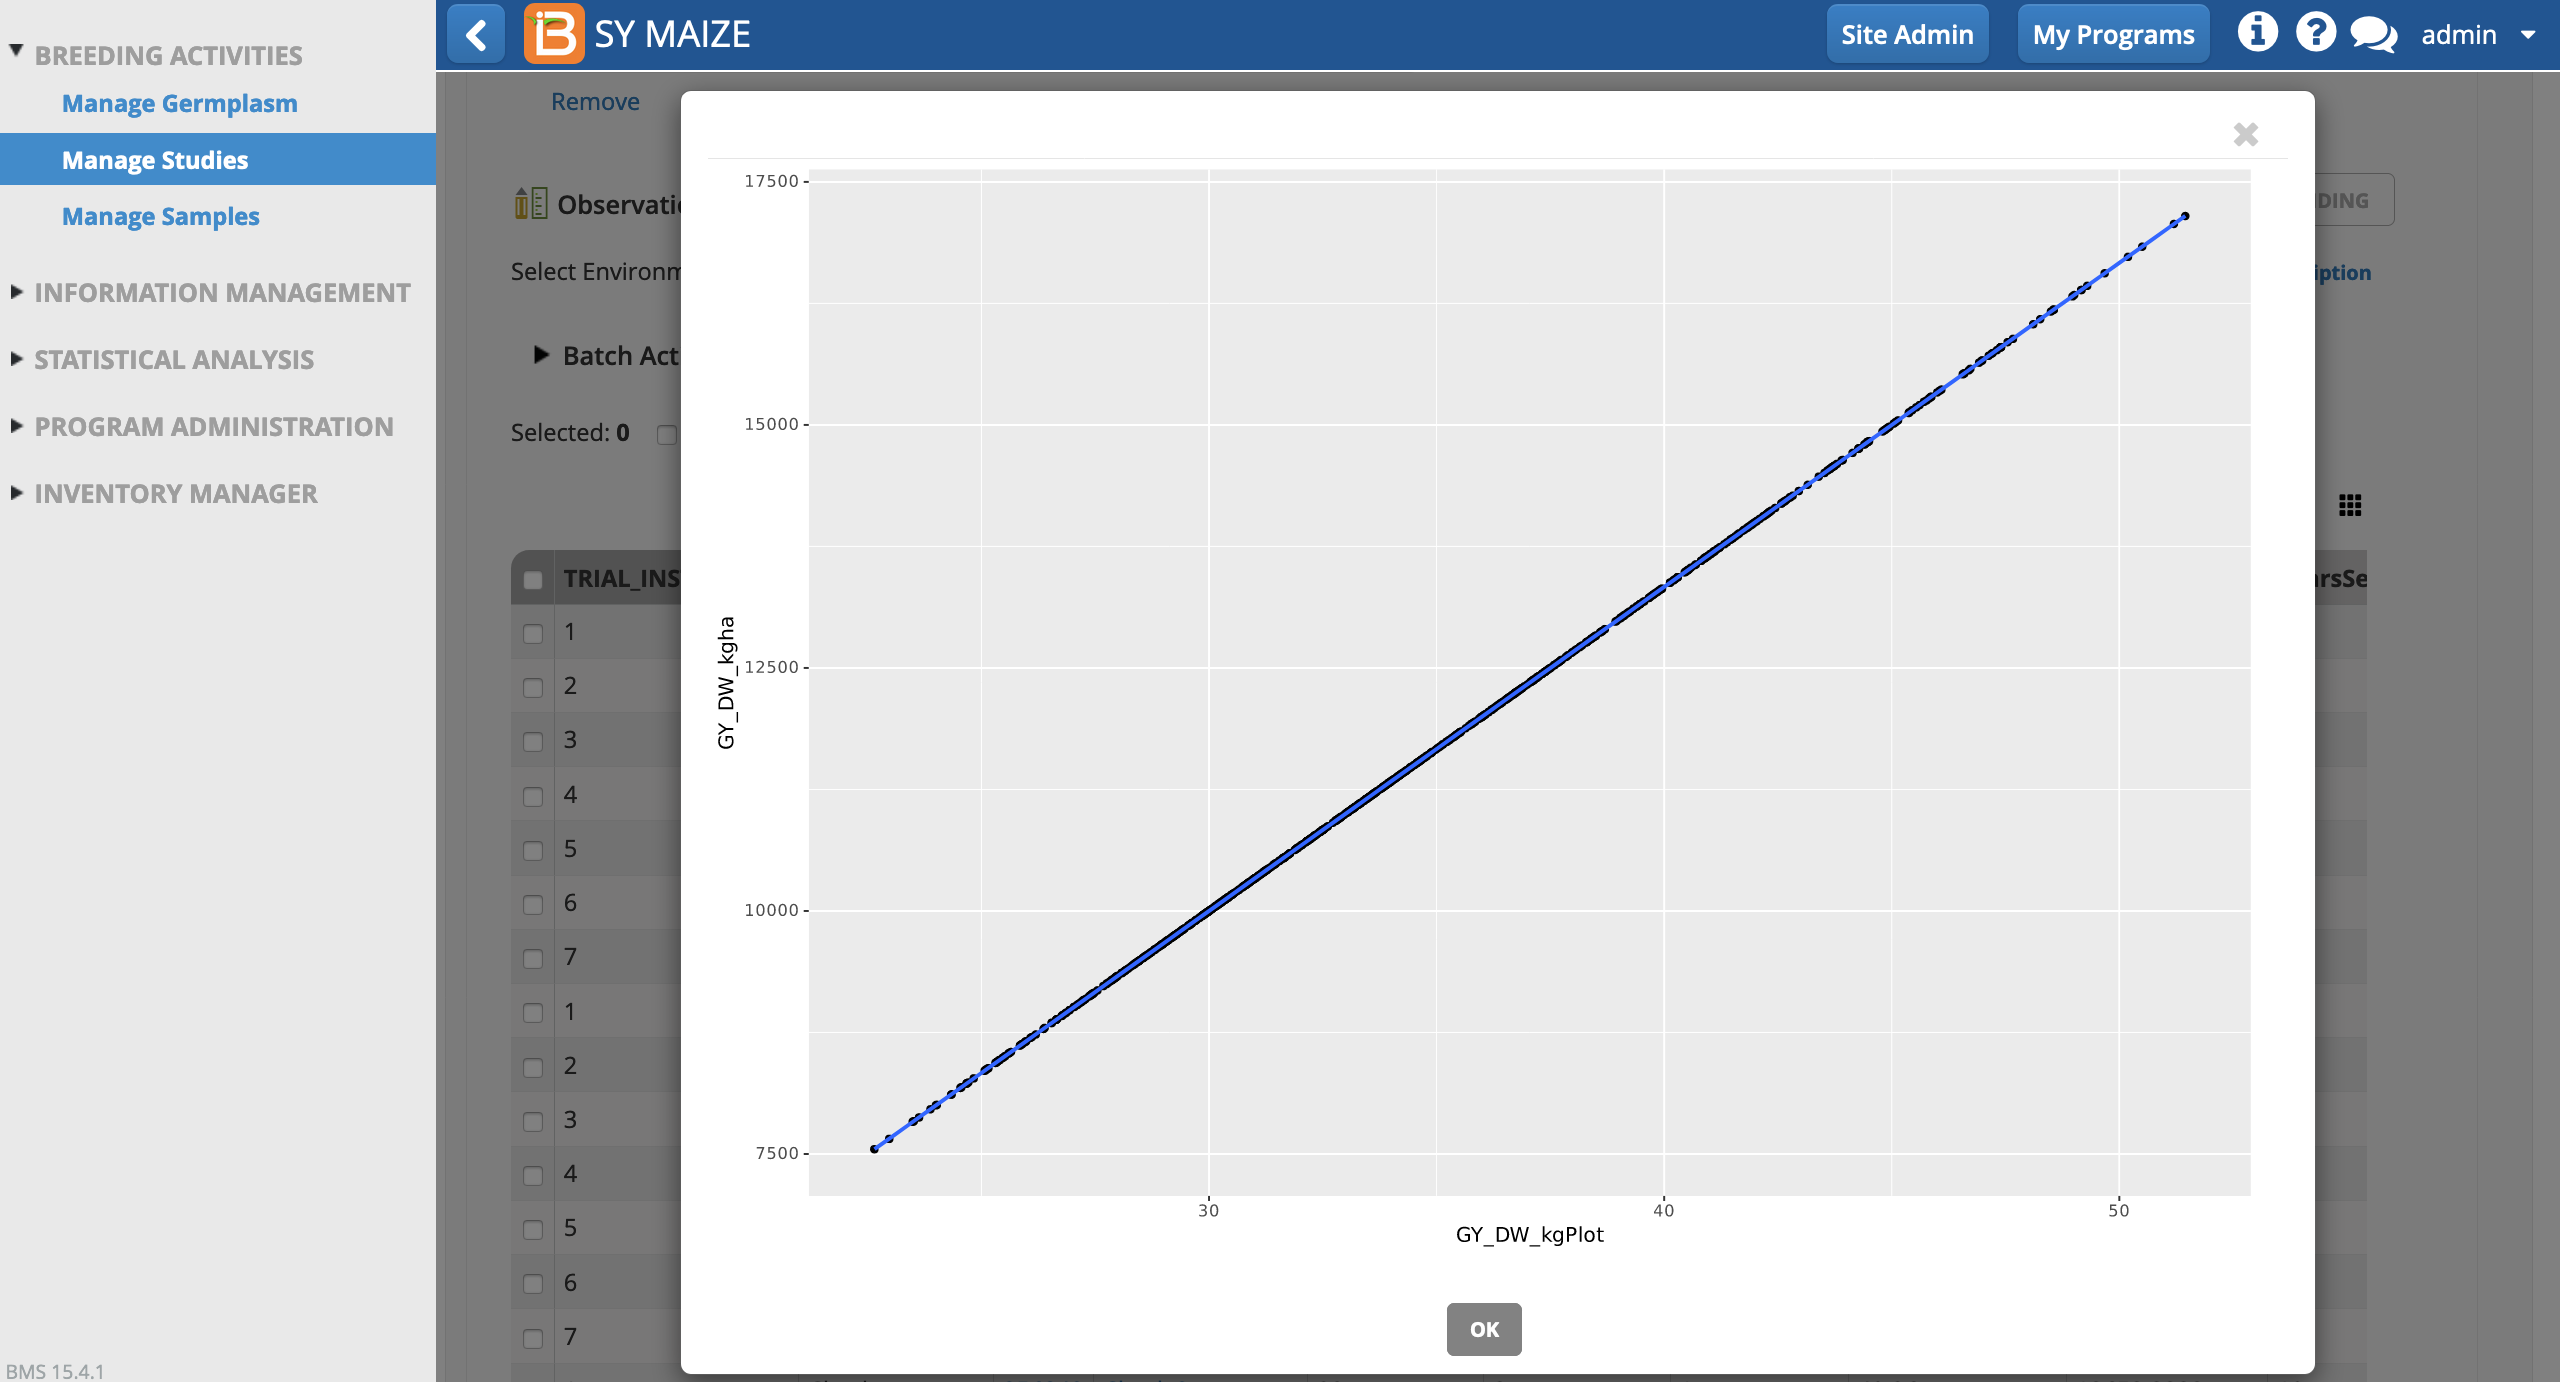
Scatterplot regression of dry weight per plot vs dy weight per hectare: The correlation in this case is perfect and not very interesting, because dry weight per hectare is calculated from dry weight.
Histogram
- Choose histogram, x-axis variable (dependent), and the bin width. Generate.

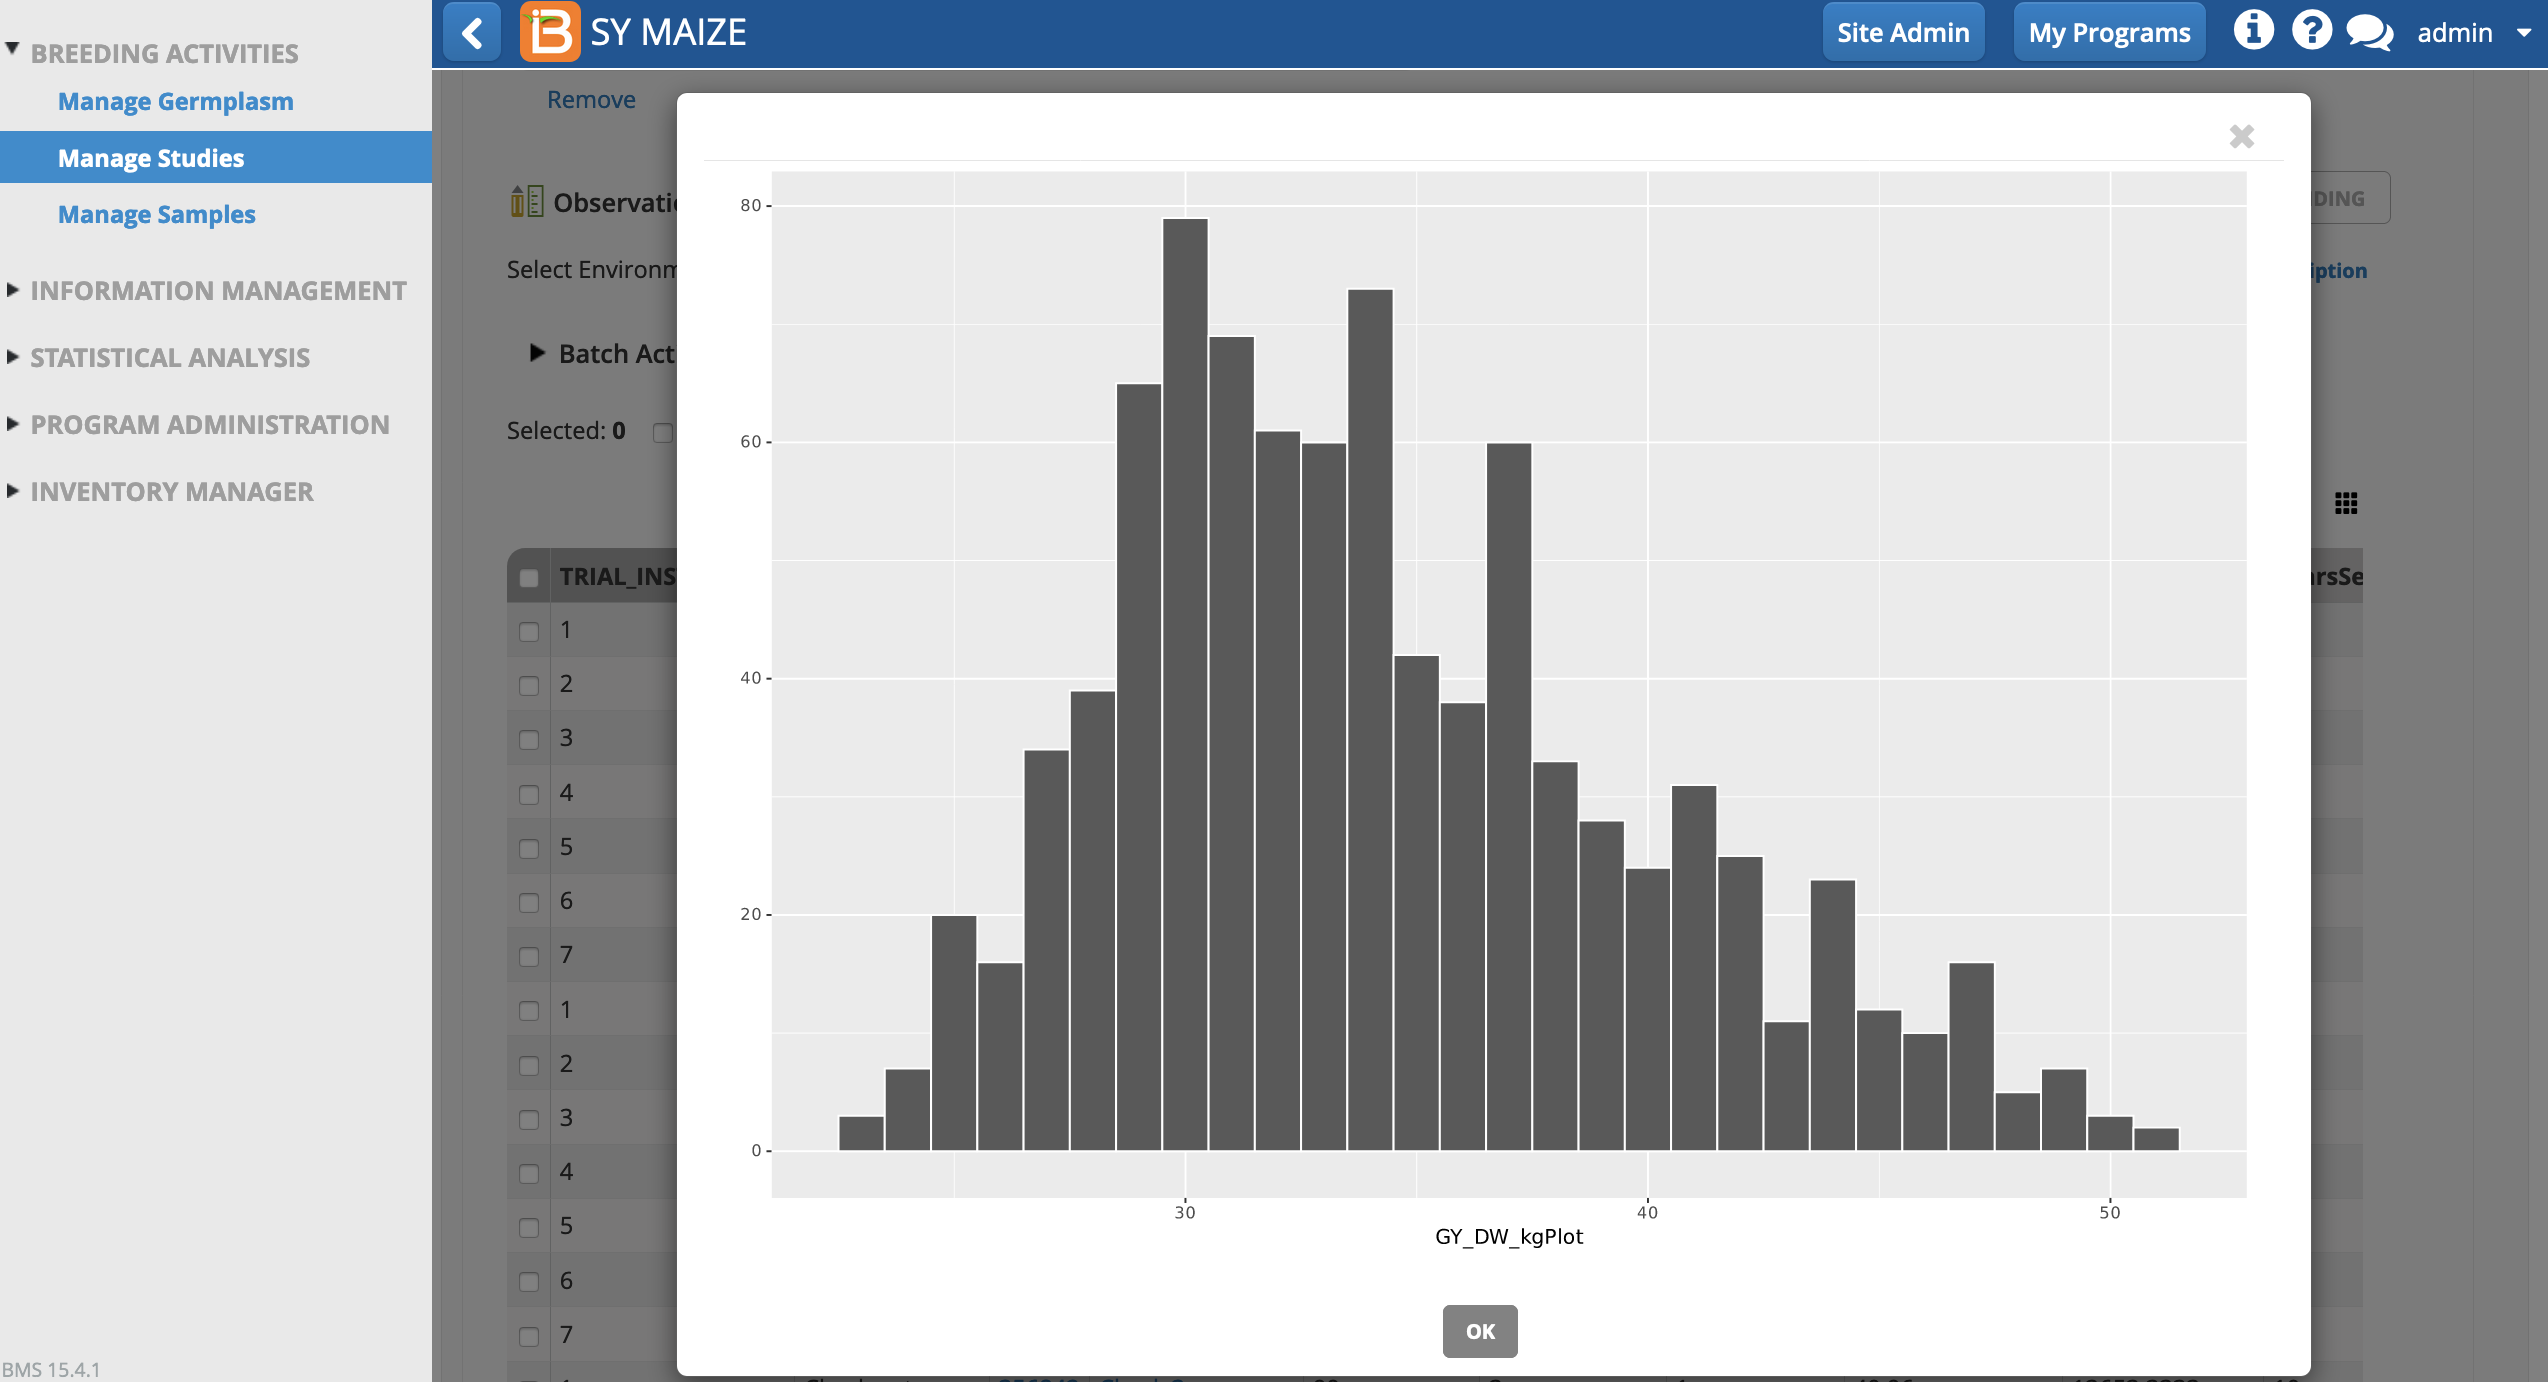
Histogram of dry weight per plot: a roughly normal distribution
Box Plot
- Choose boxplot, factor by one of the study's independent variables (x-axis), and choose one of the studies dependent variables. Generate.

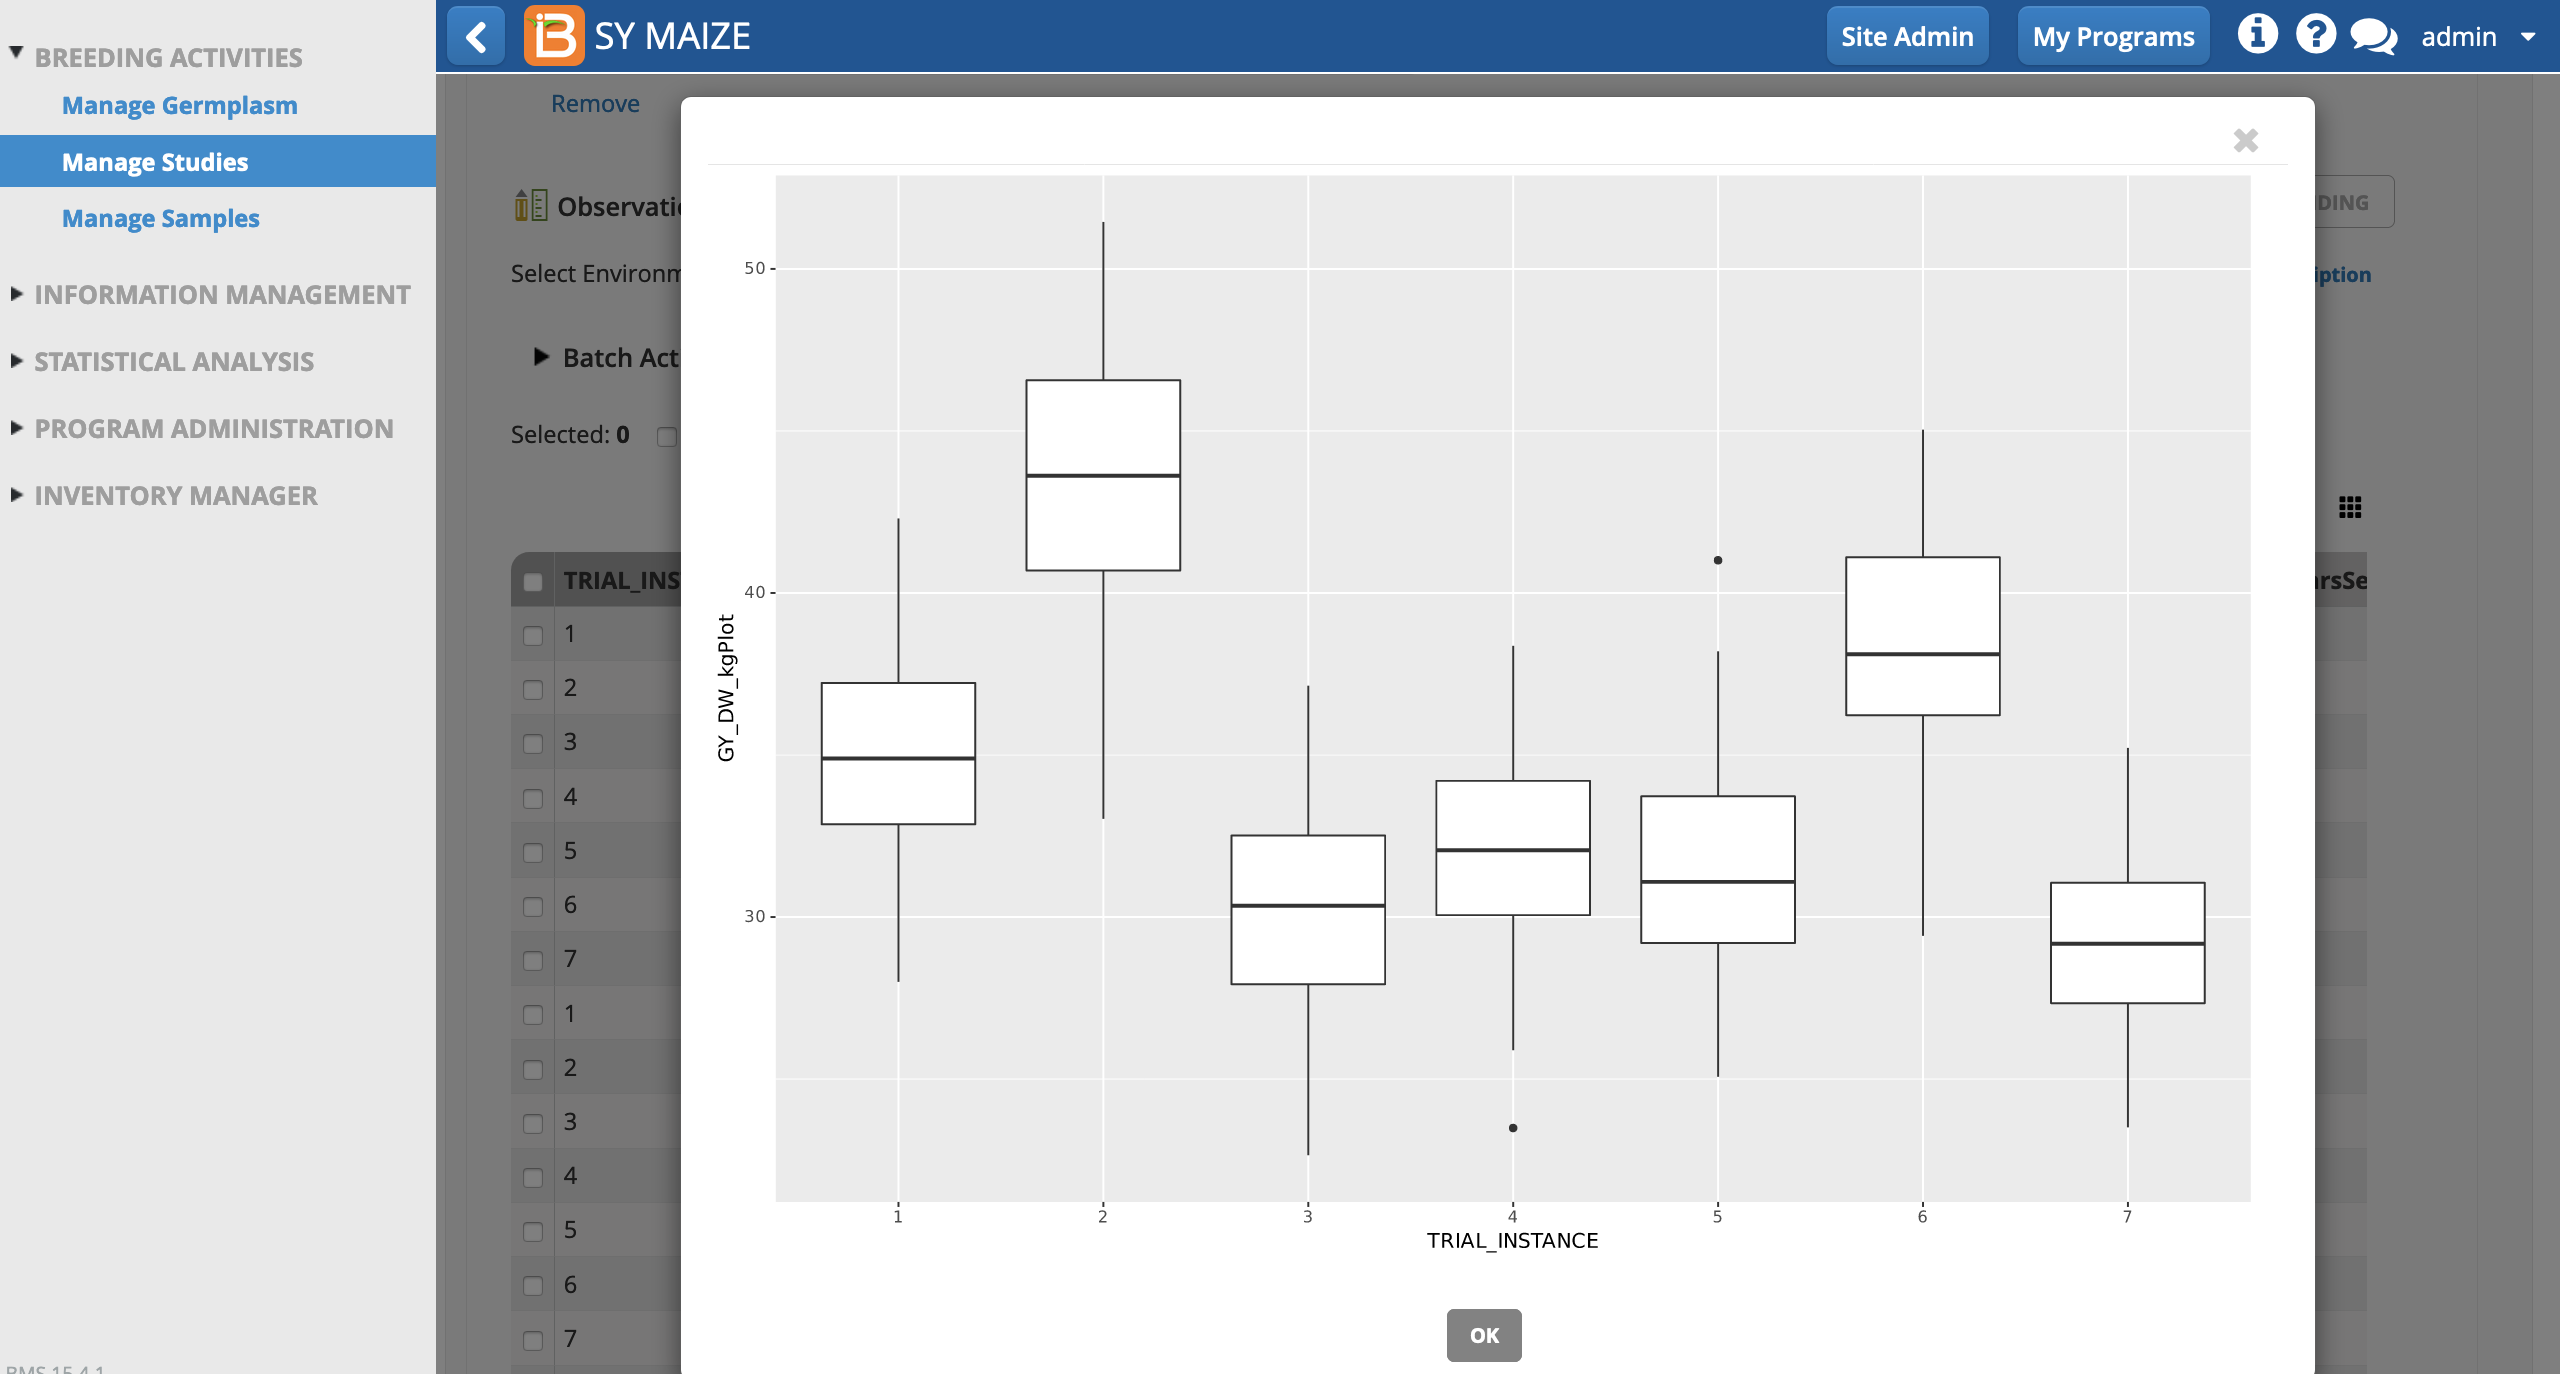
Boxplot of trial instance (location) by dry weight per plot: Notice that location 2 out performed other locations, and that locations 4 and 5 have possible outlier measurements, indicated by the black dots.
Calculate Variables
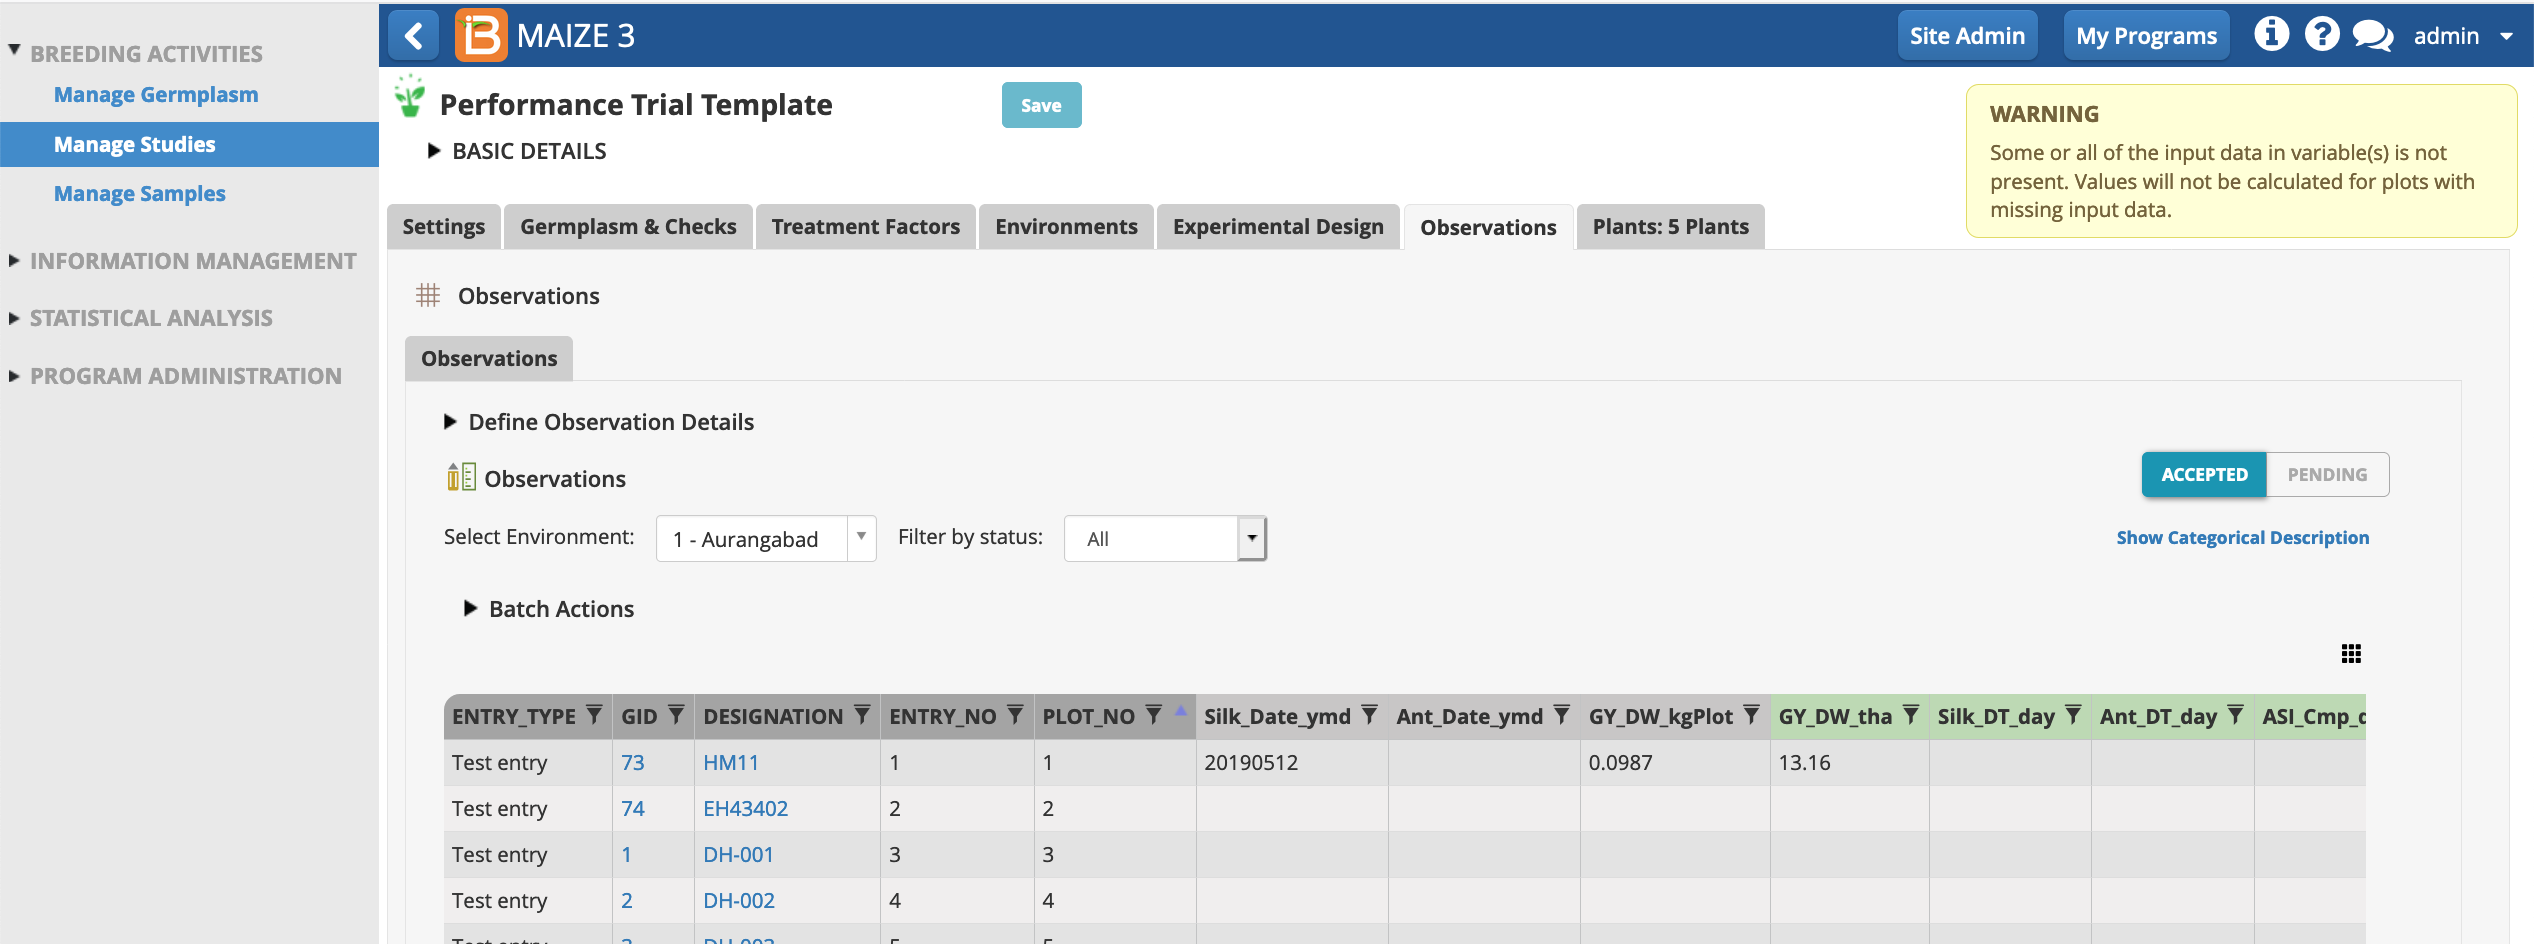
Derived variables with BMS specified calulations are highlighted green within the measurements tab. The input variables are visible in the trait summary. (See more on adding Formulas to traits in the Ontology).
- Select execute calculated variable.
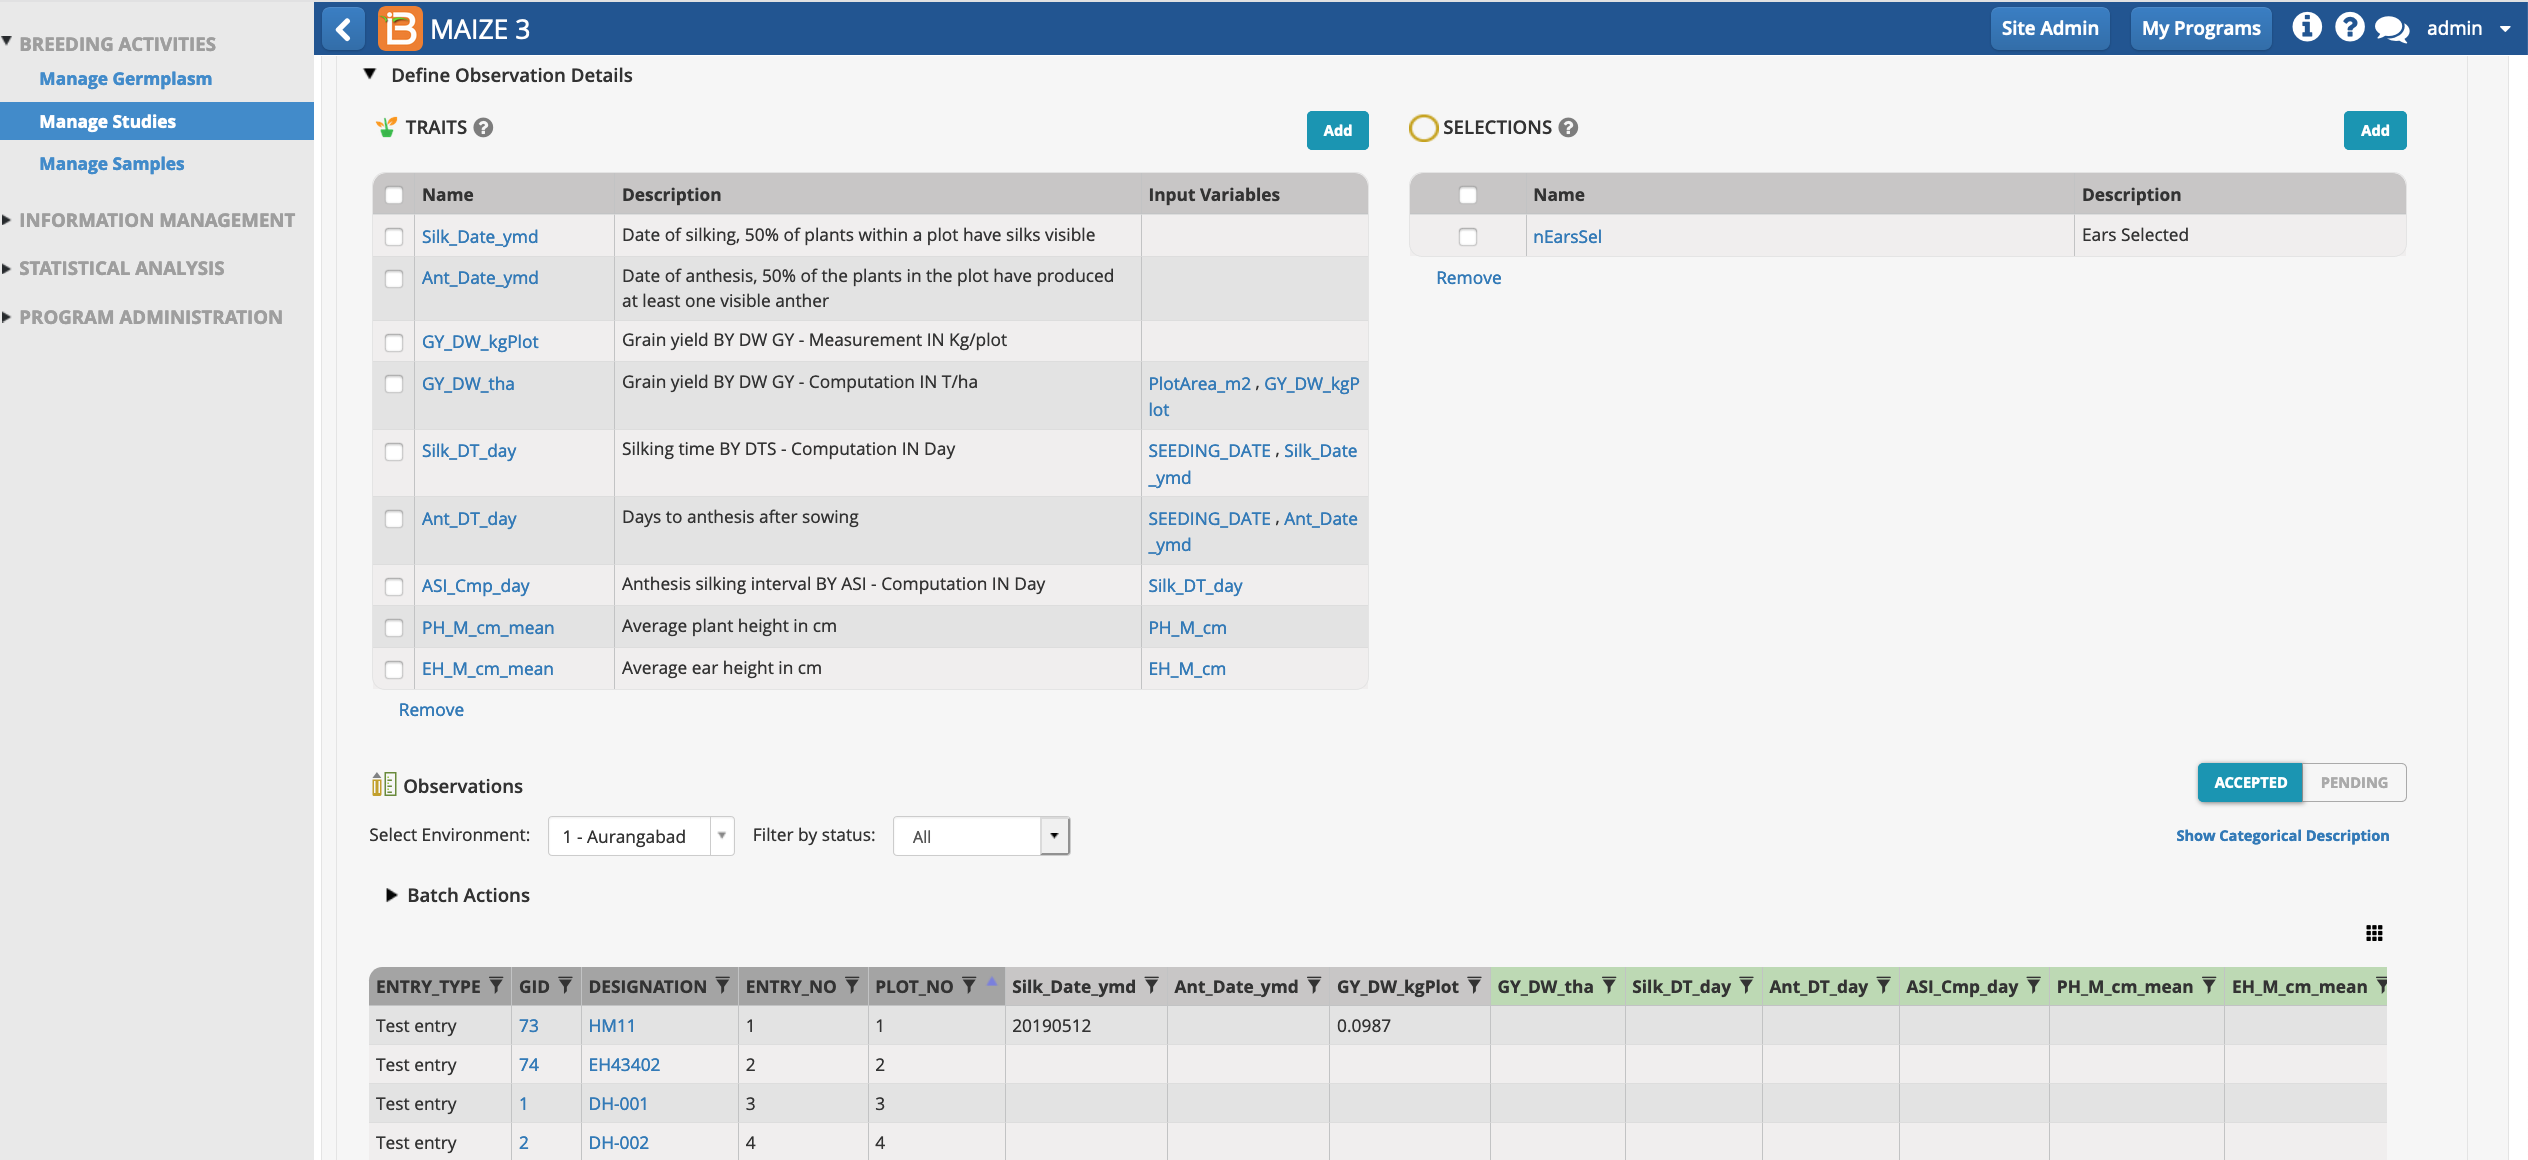
The first row, HM11, contains input data for two derived traits. For example, dry grain yield (kg/plot) can be used with plot size to calculate dry grain yield (t/h) using this formula, ({{GY_DW_kgPlot}}* 1000/{{PlotArea_m2}}).
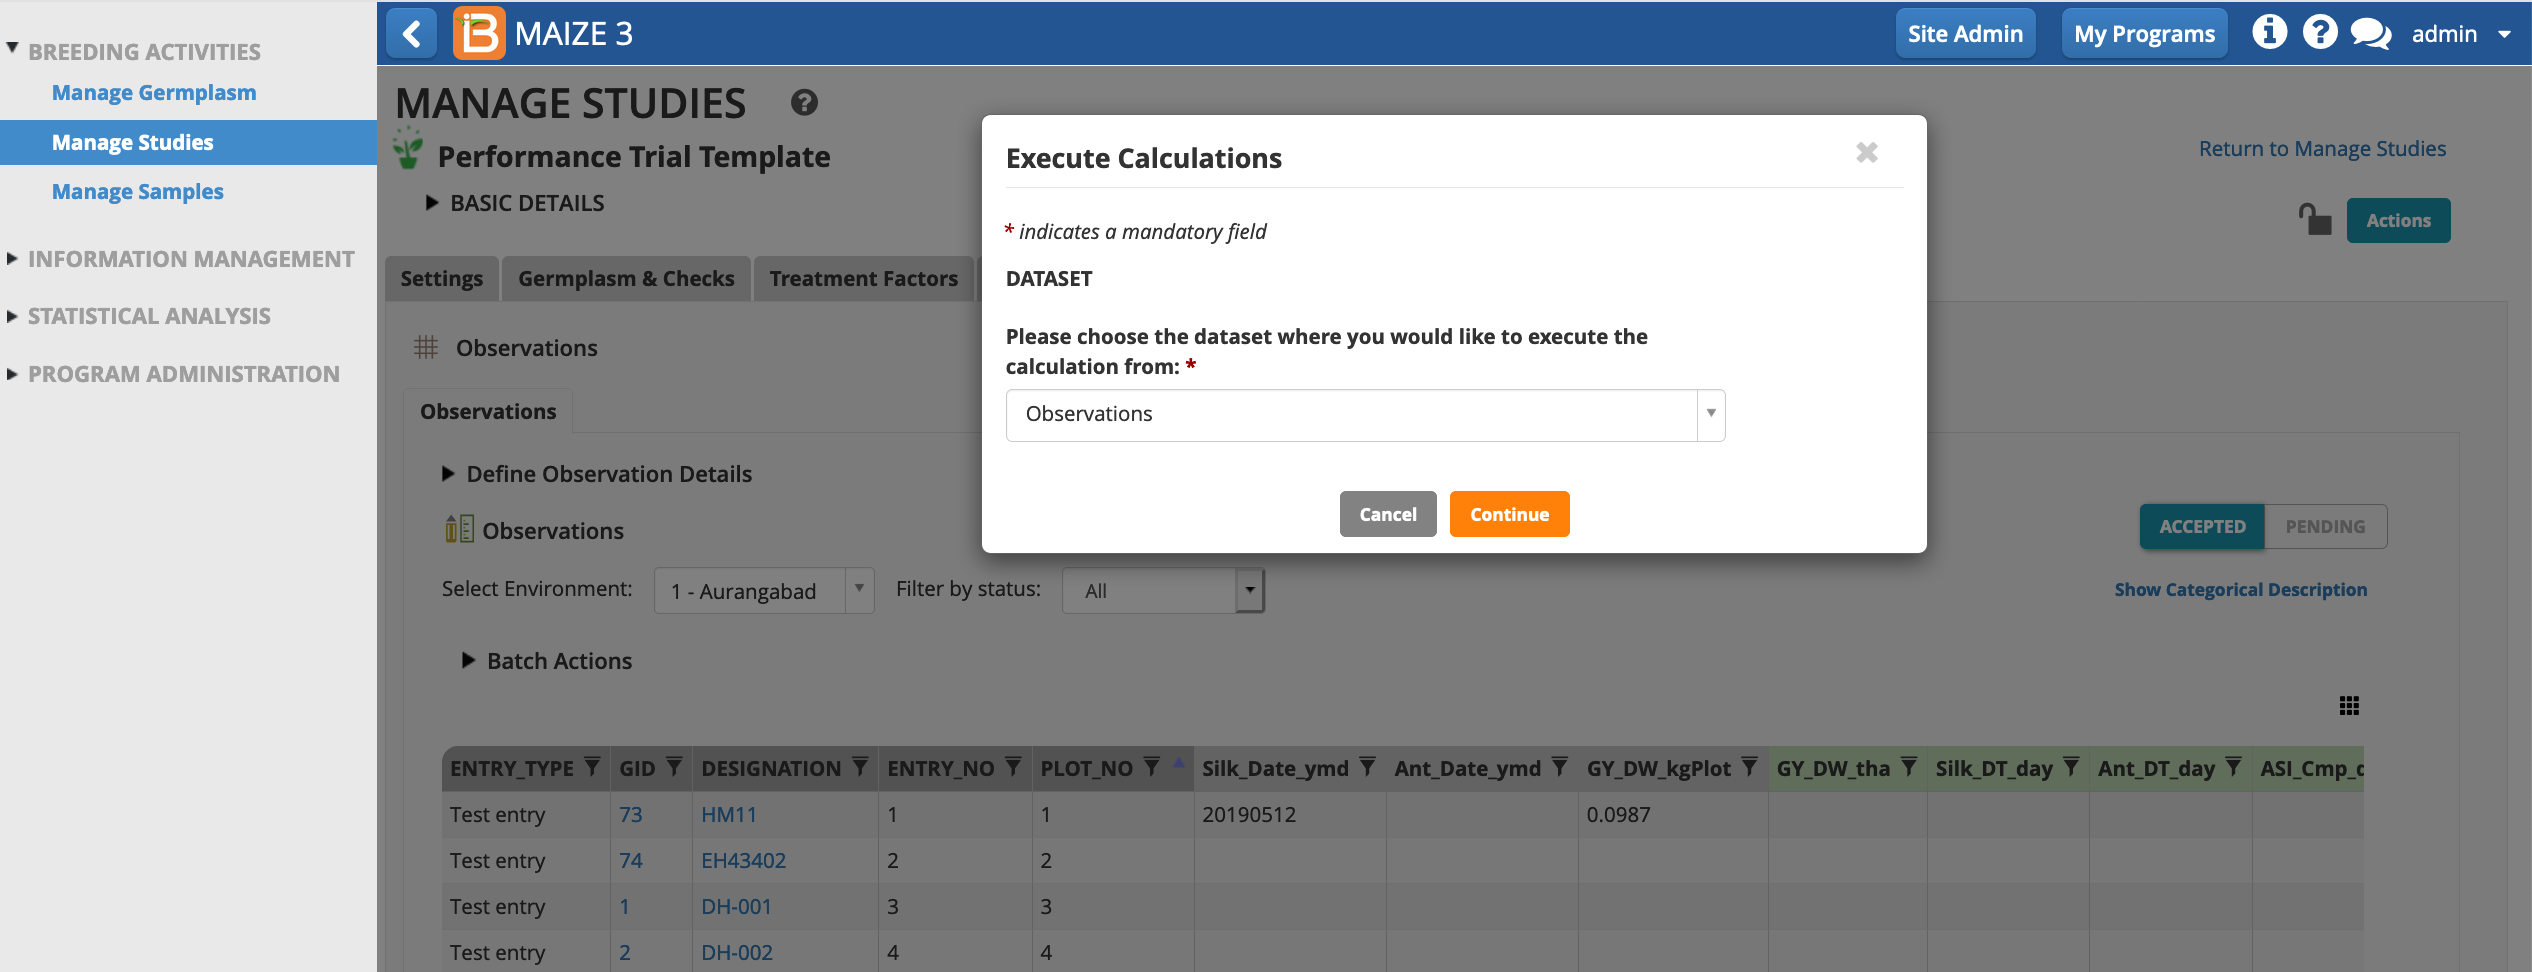
- Select the appropriate dataset. Continue.
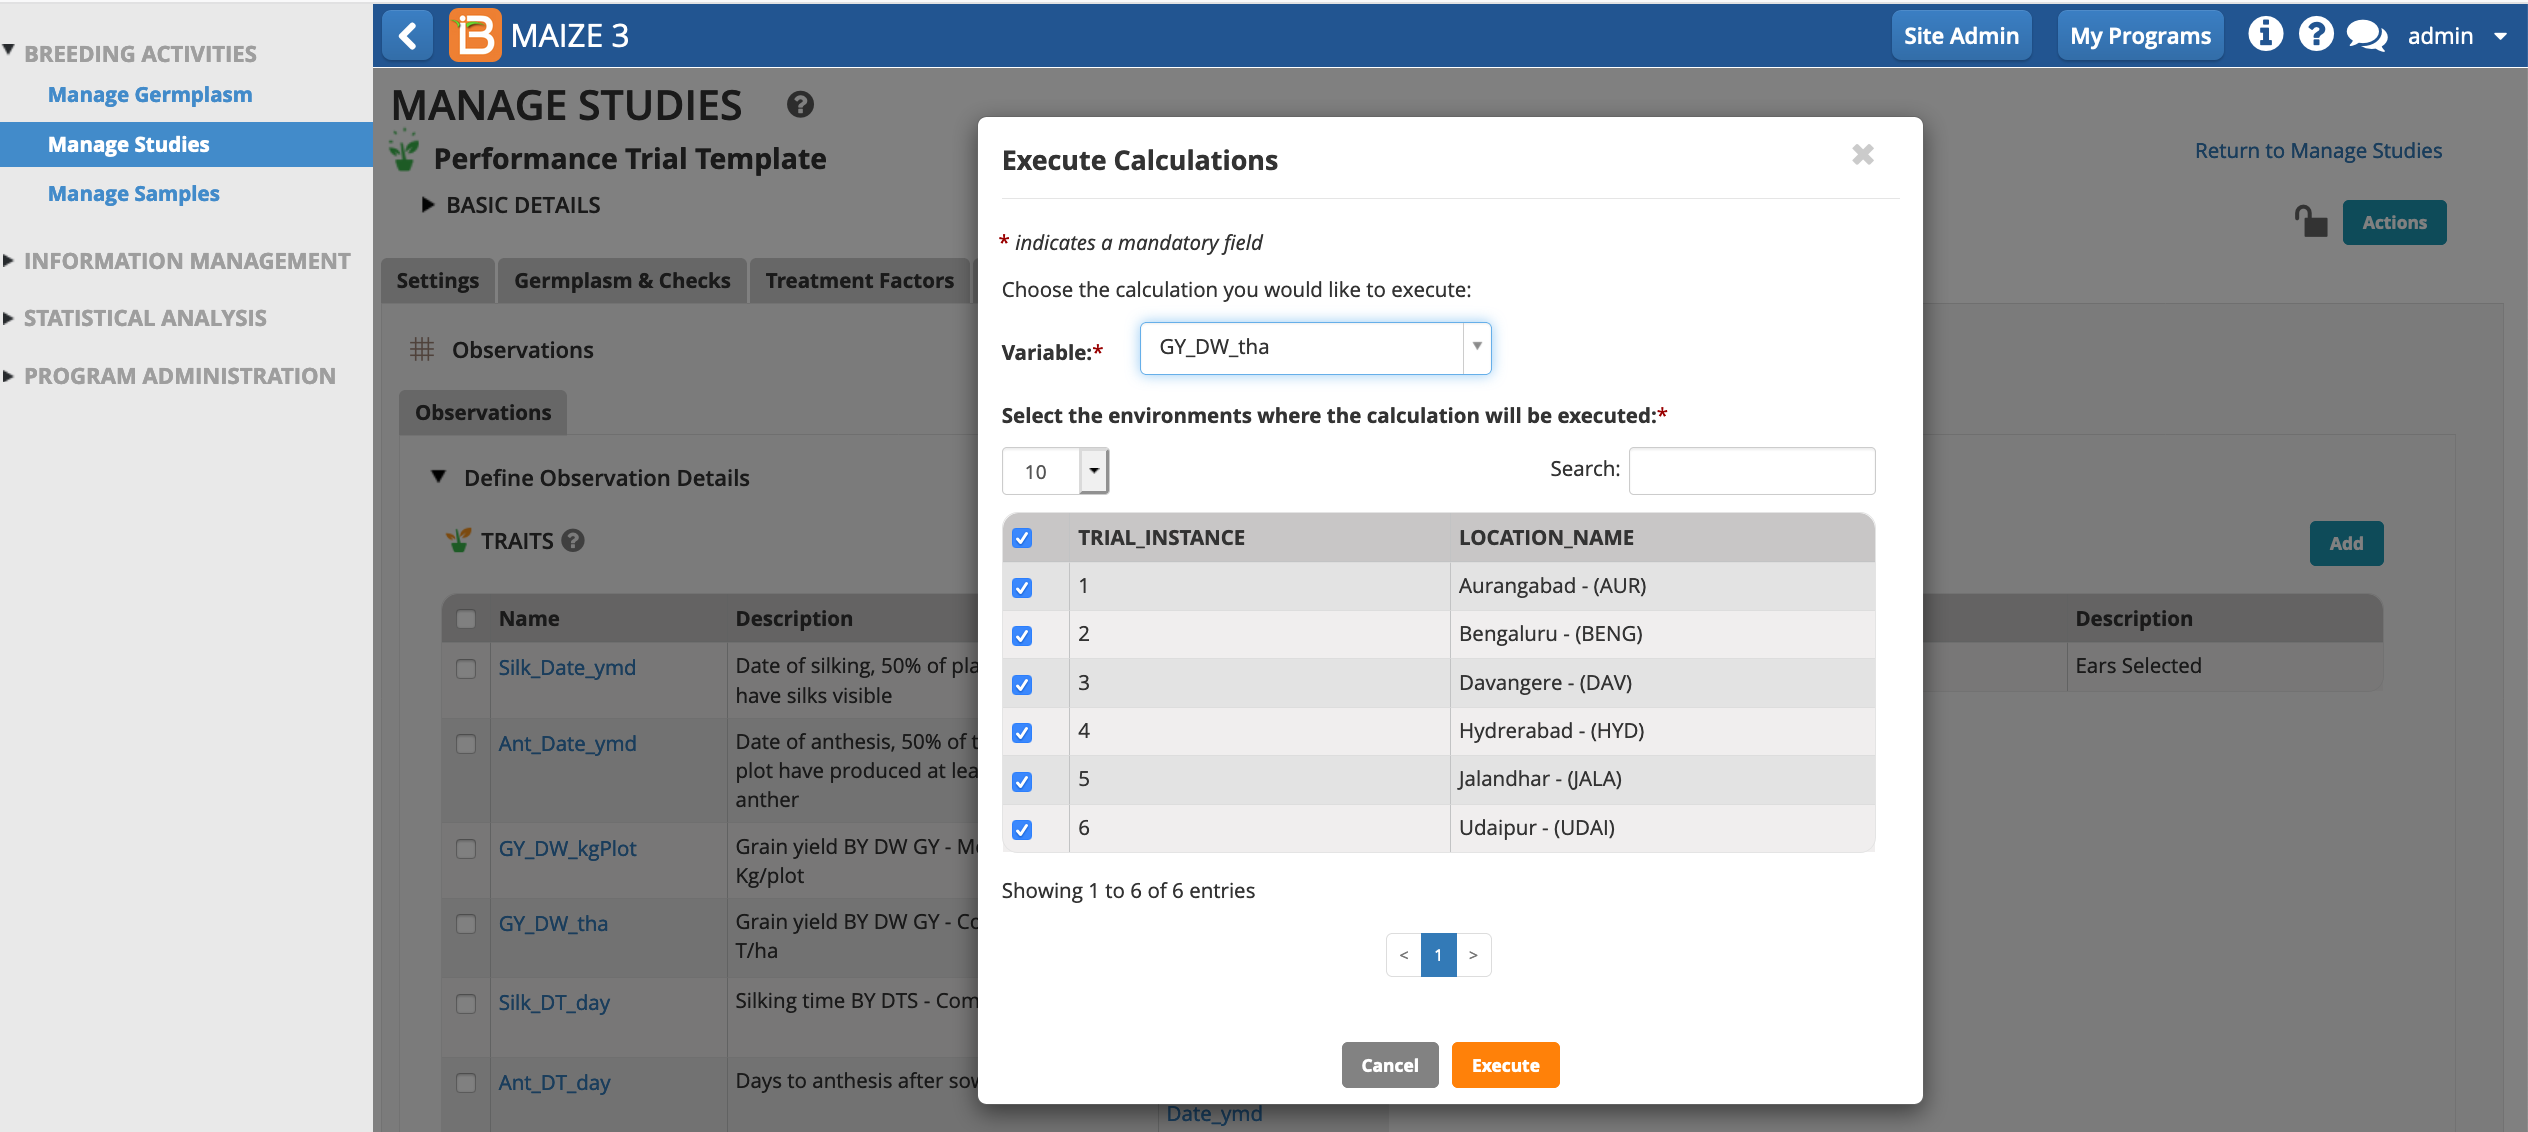
- Select the derived variable and instance(s) to execute calculation. All instances are selected by default. Execute.
The calculated value(s) for the derived variable, GY_DW_tha, now populate the observation. Only a single plot had enough data entered to calculate GY_DW_tha. A warning message alerts you to that the other plots have missing data, preventing the calculation.
