- About
- Observations
- Create Sub-Observation Unit Dataset
About
Once the study design has been generated or imported, the Observations table is populated with independent study variables and sub-observation datasets can be created to record repeated measures.
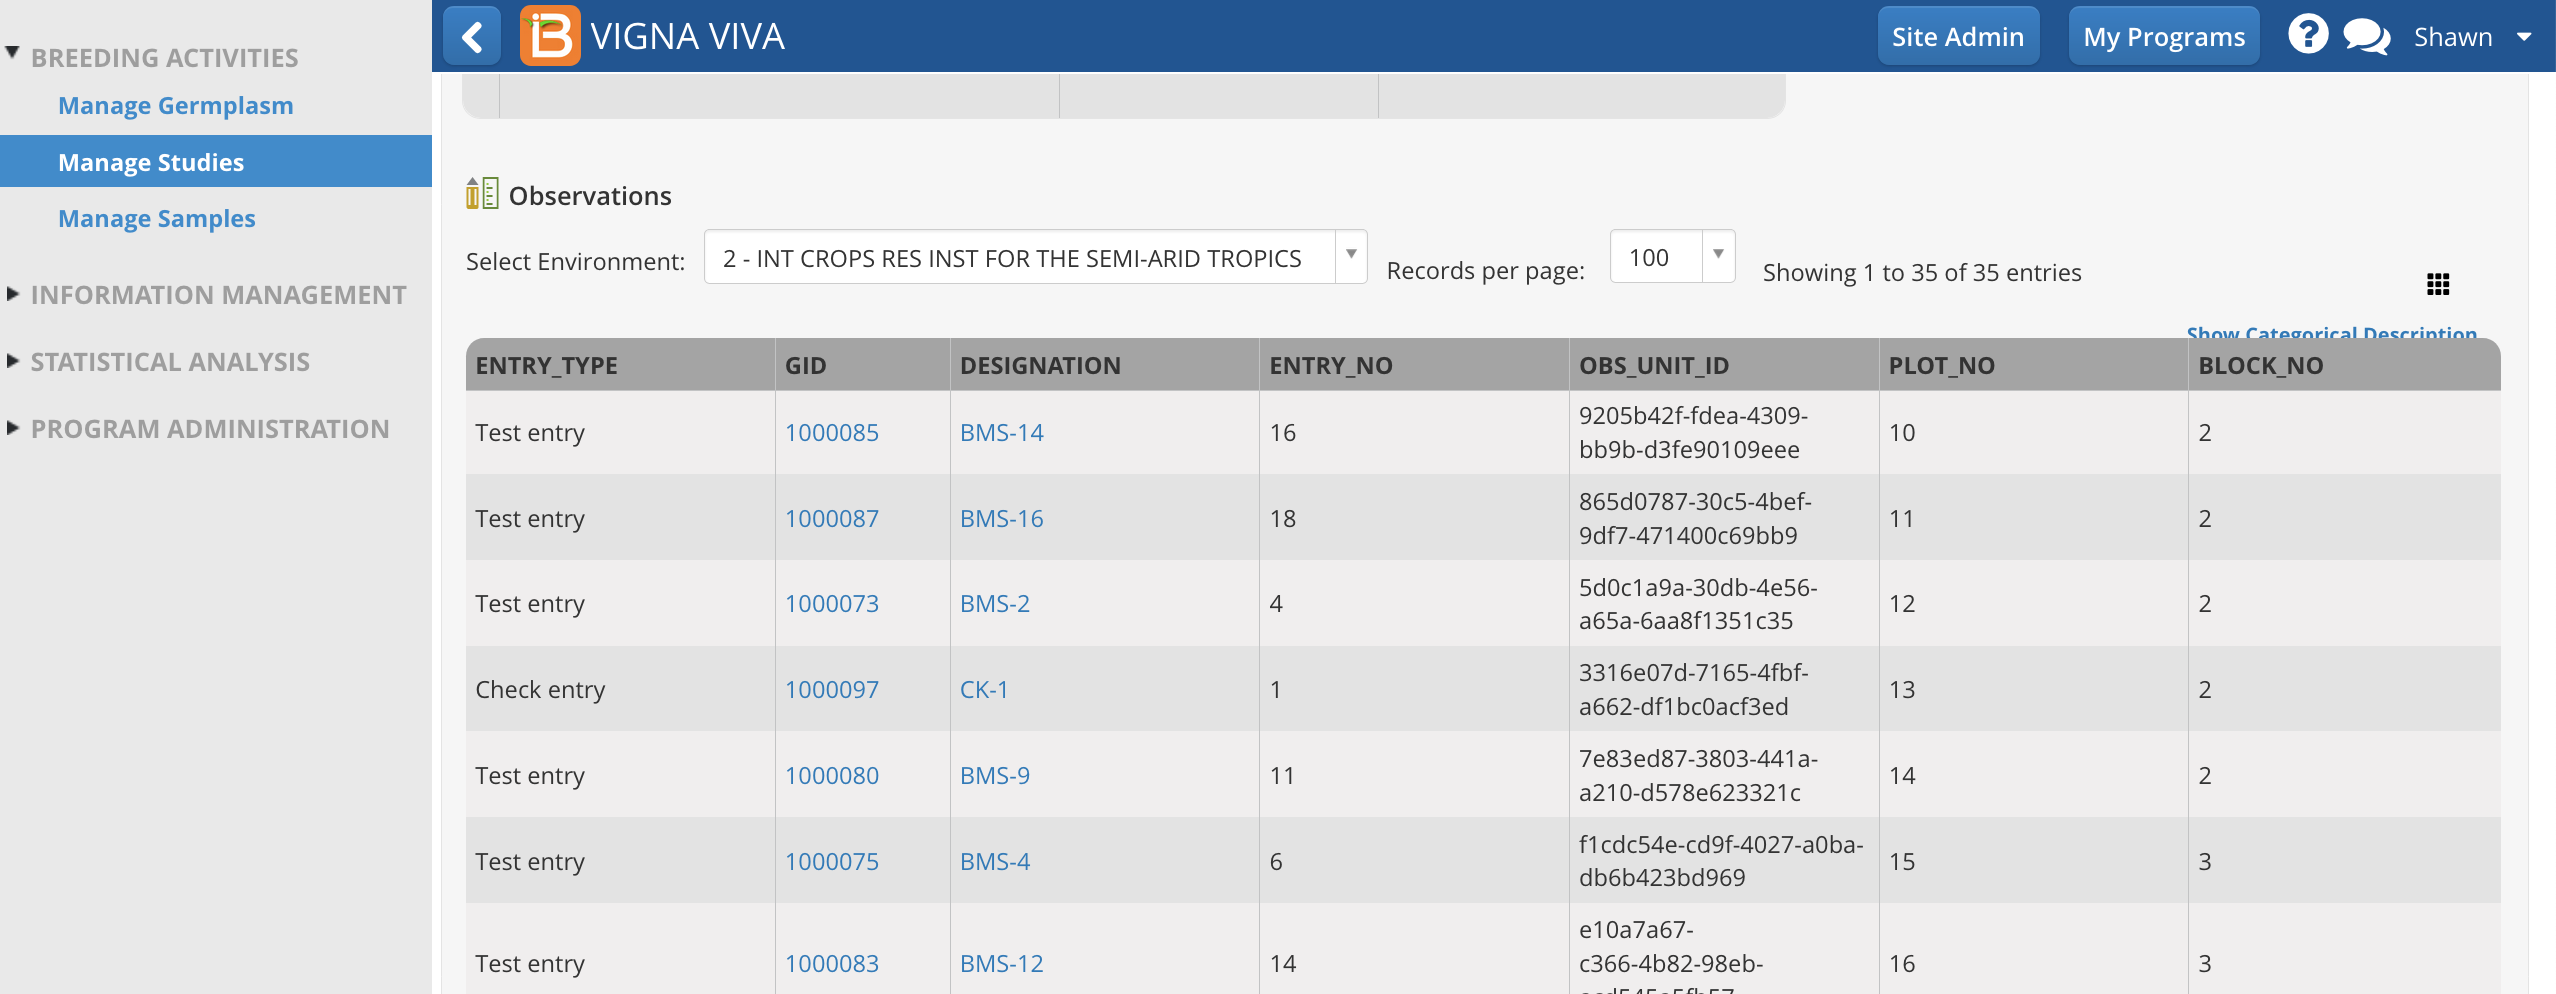
Observations
The rows of Observations table represent the experimental units, which are randomized or non-randomized depending on design. Experimental units can be defined in many ways: plots, pots, individual plants, fruits, ect. The manual will use "plots" to describe the highest level of observation, as this is the most common experimental unit in breeding.
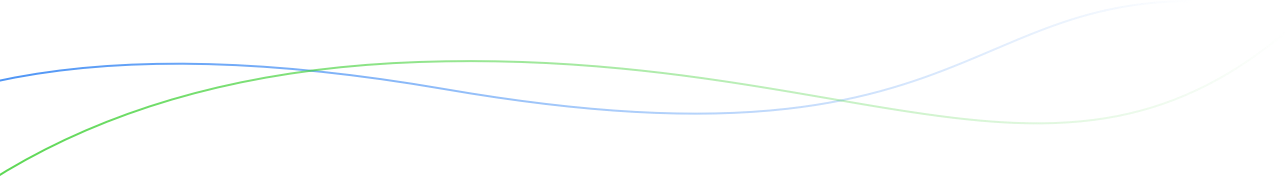
- Saving the trial will paginate the Observations table by environment. Select any environment to review the plot details.
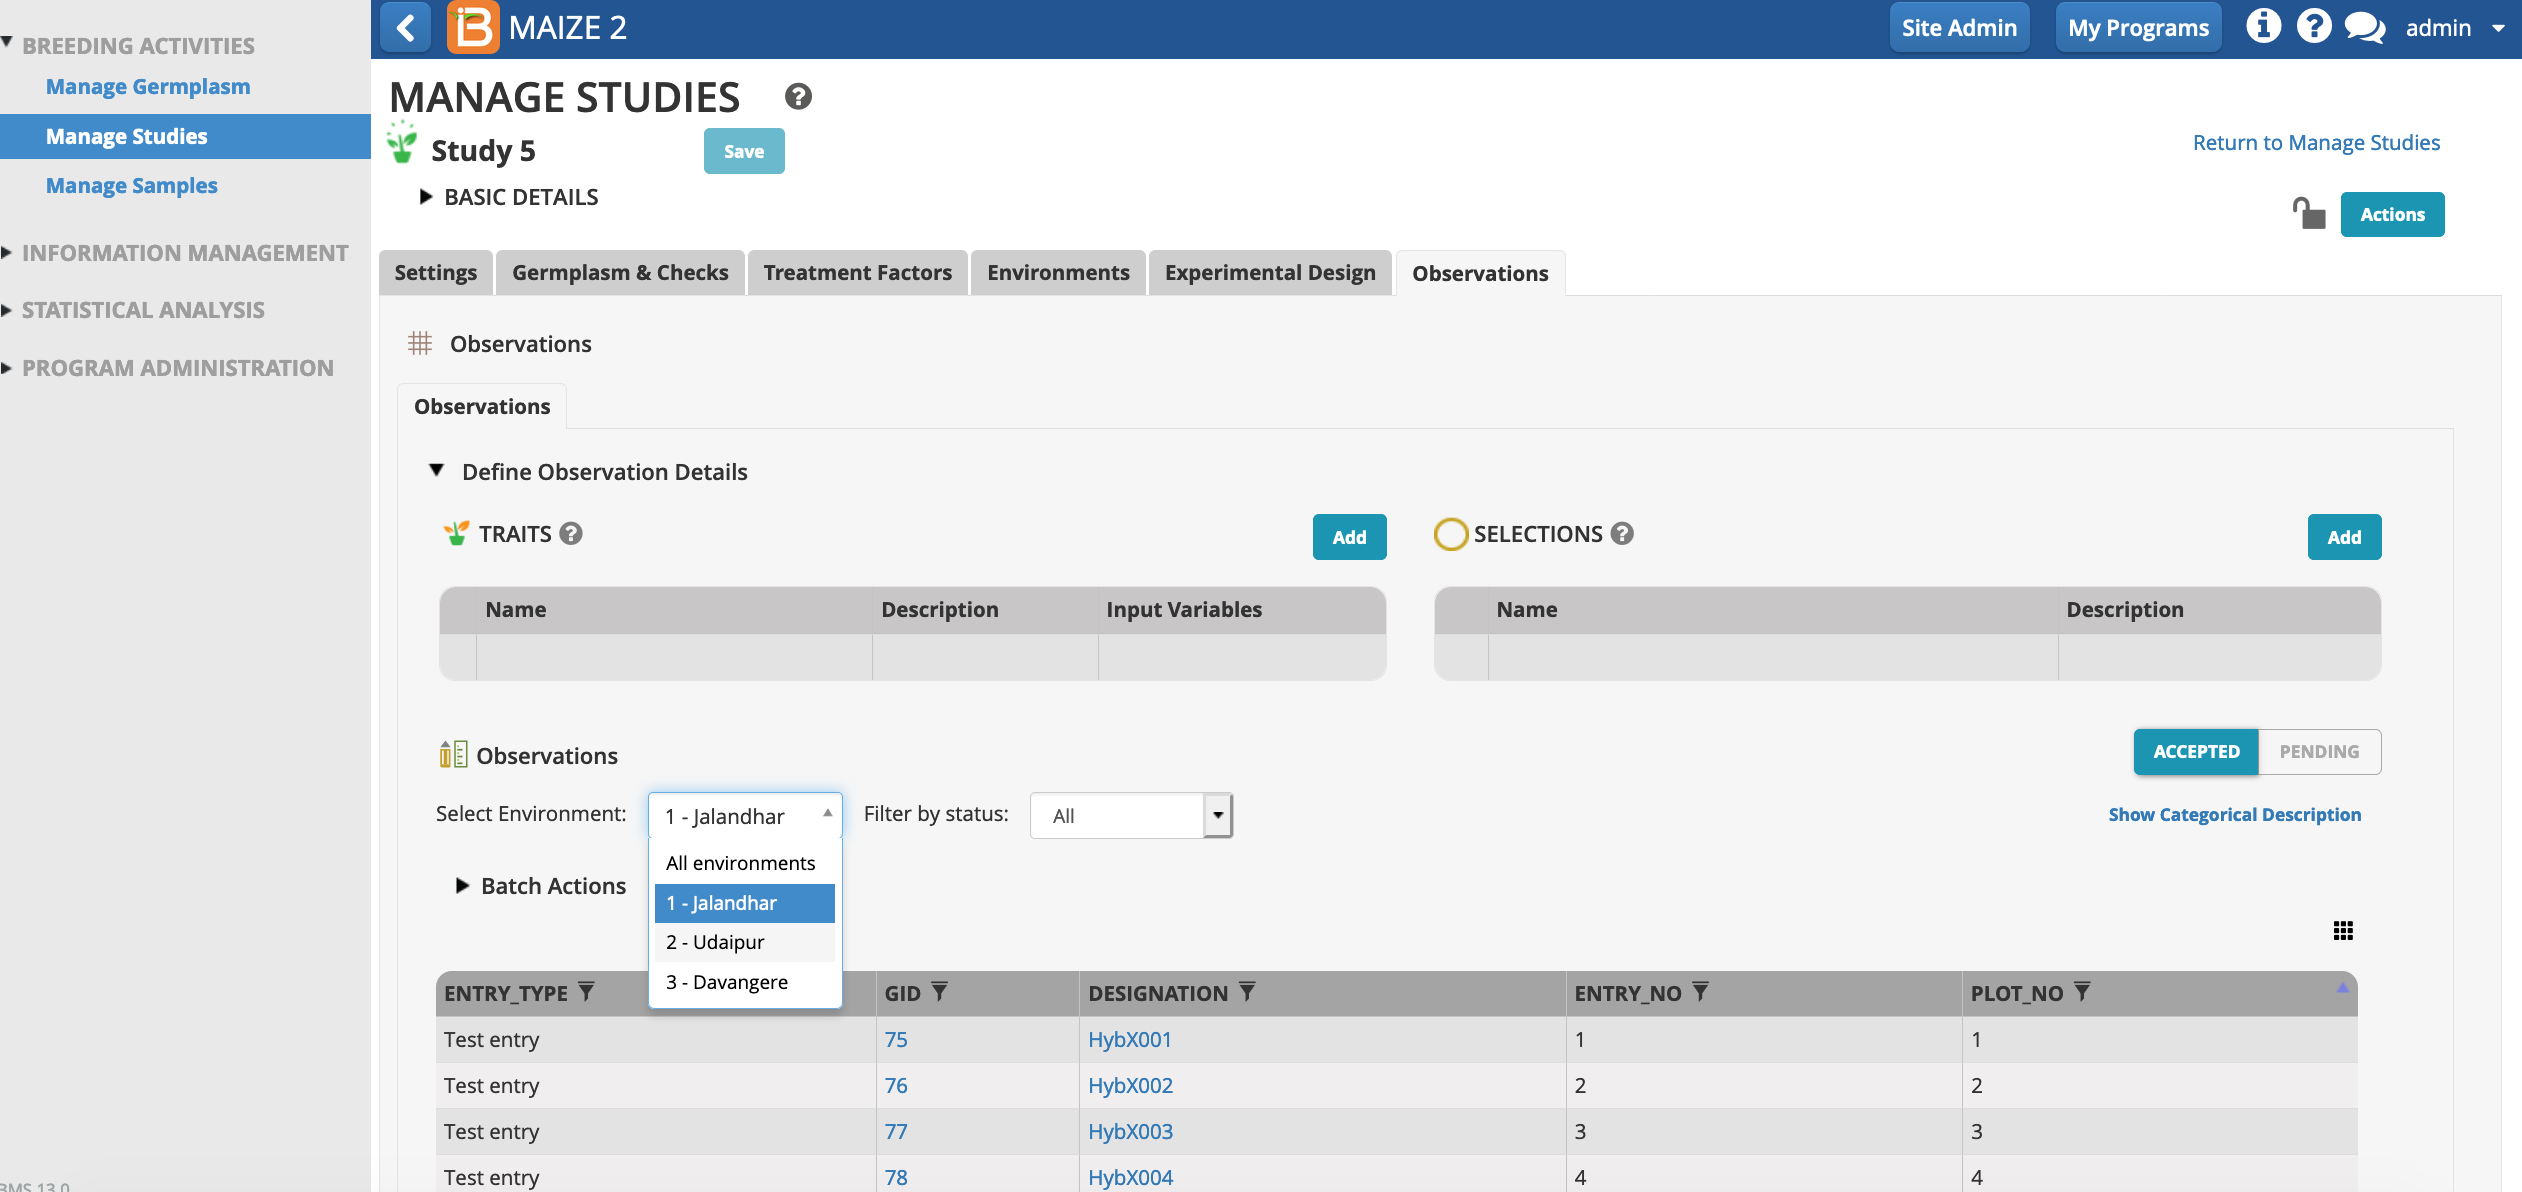
Reveal/Hide Columns
Independent variables can be hidden and revealed in the tabular user interface. One important column, OBS_UNIT_ID, is hidden by default, because it is not meant to be human readable. OBS_UNIT_ID is an alphanumeric sequence designed for data capture that uniquely identifies the observation. The OBS_UNIT_ID is appropriate for barcoding the observation unit (plot, plant, pot, ect...) when the Study Book file is exported
- Make columns of data by visible/hidden by selecting the dotted rectangle.
OBS_UNIT_ID is be revealed in the user interface after the selection.
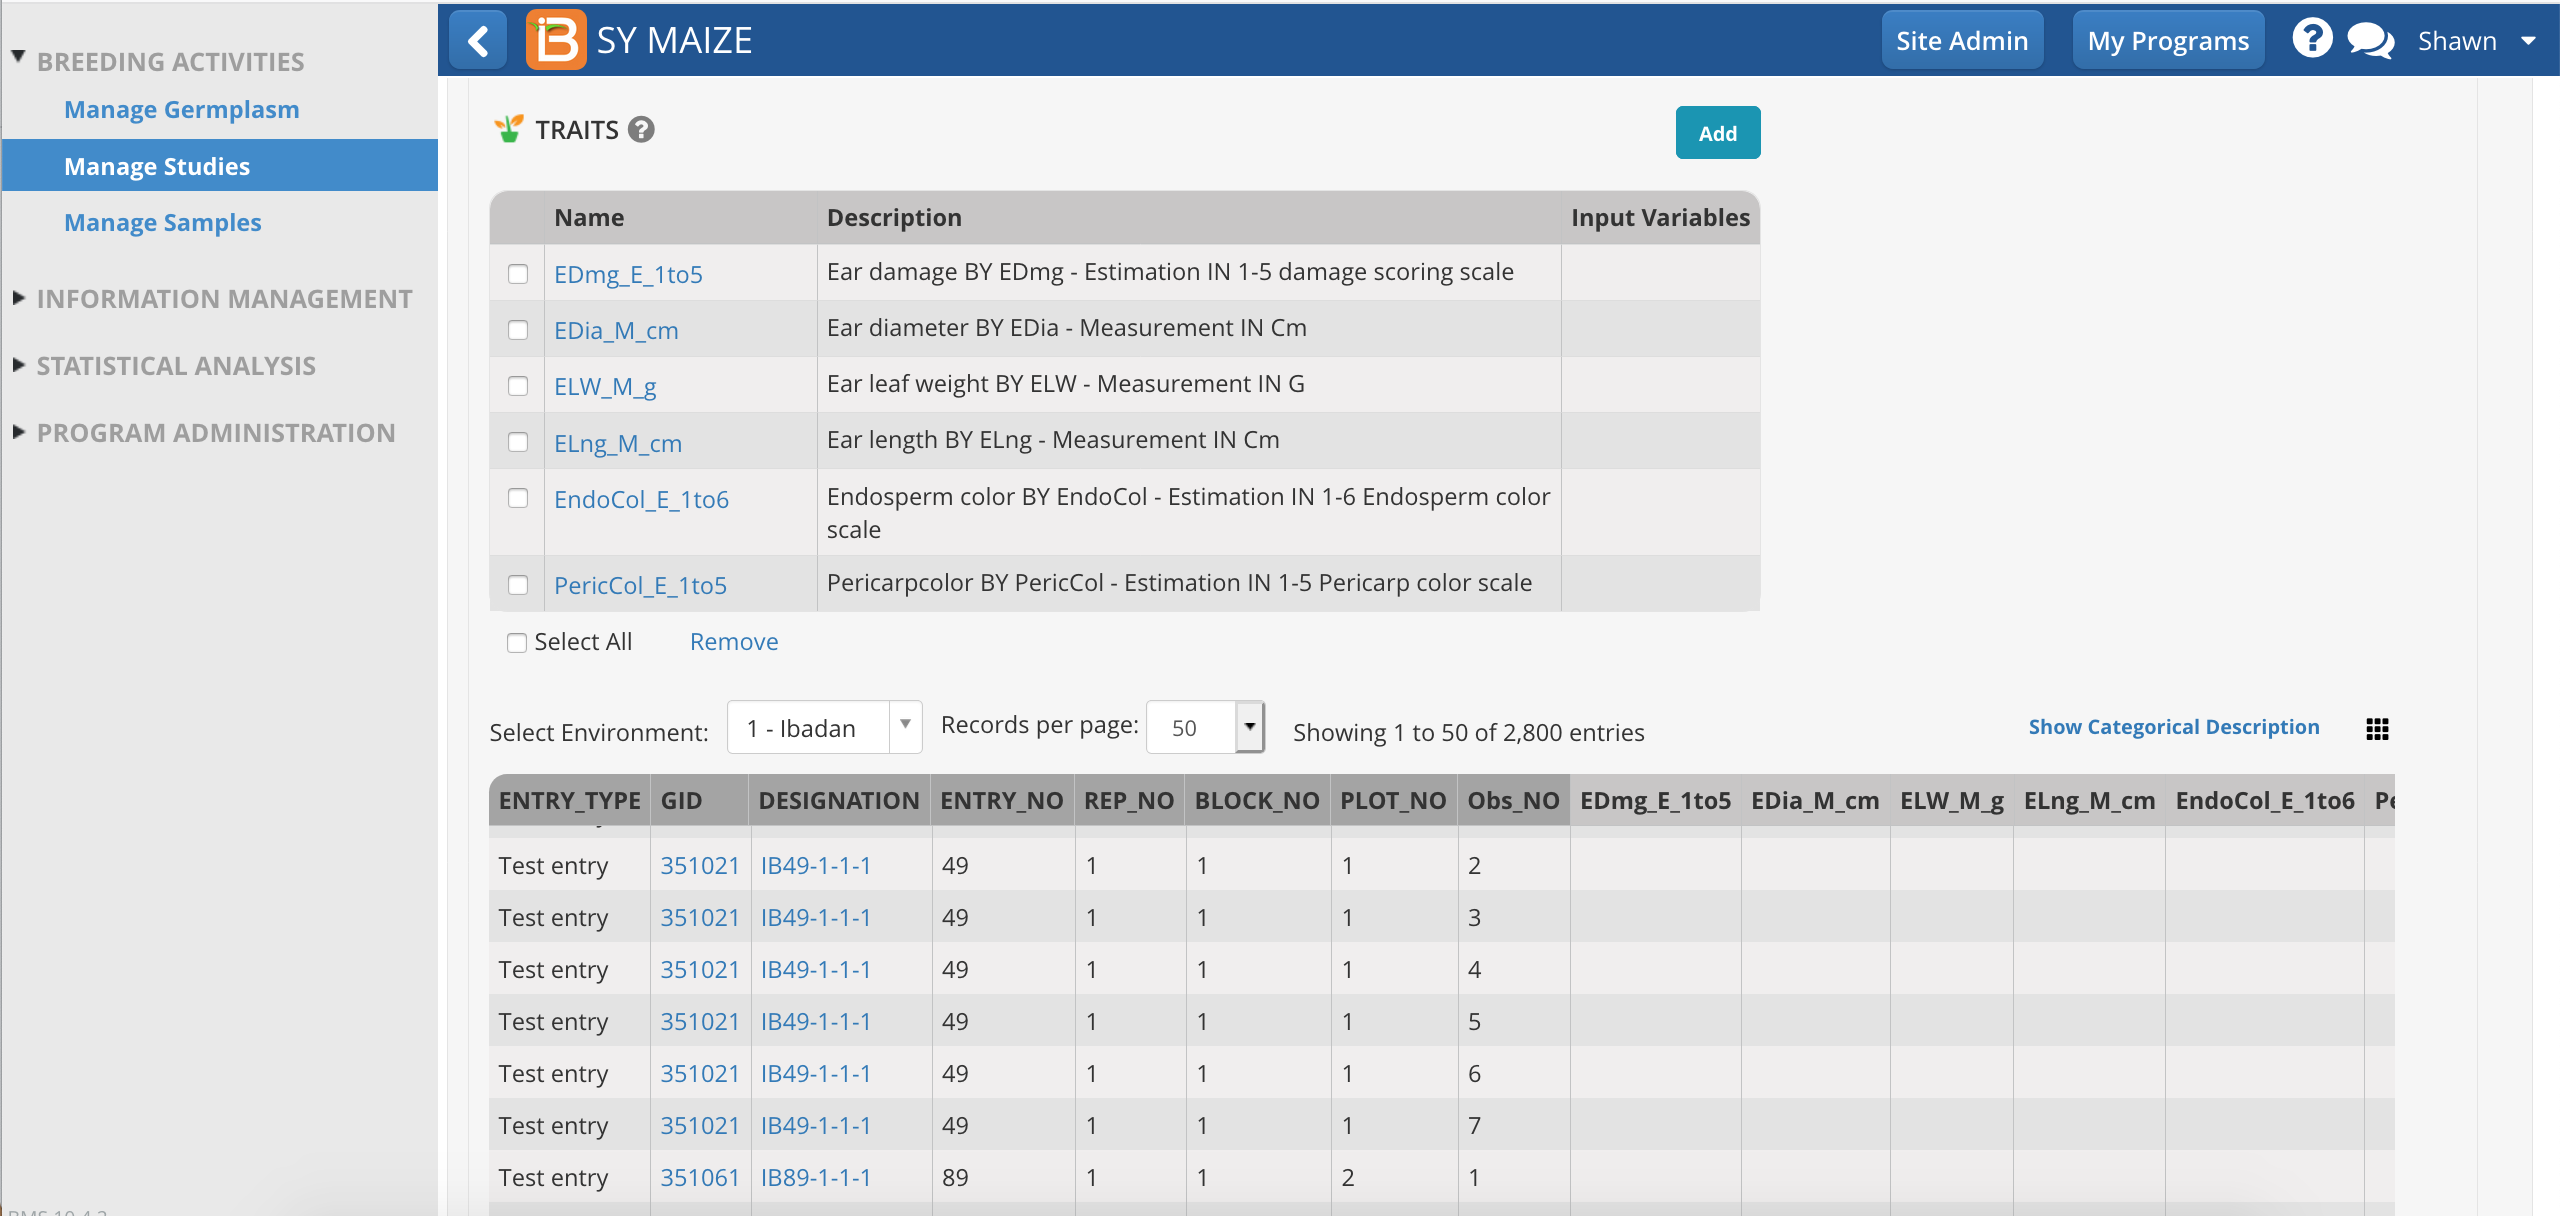
Add Traits
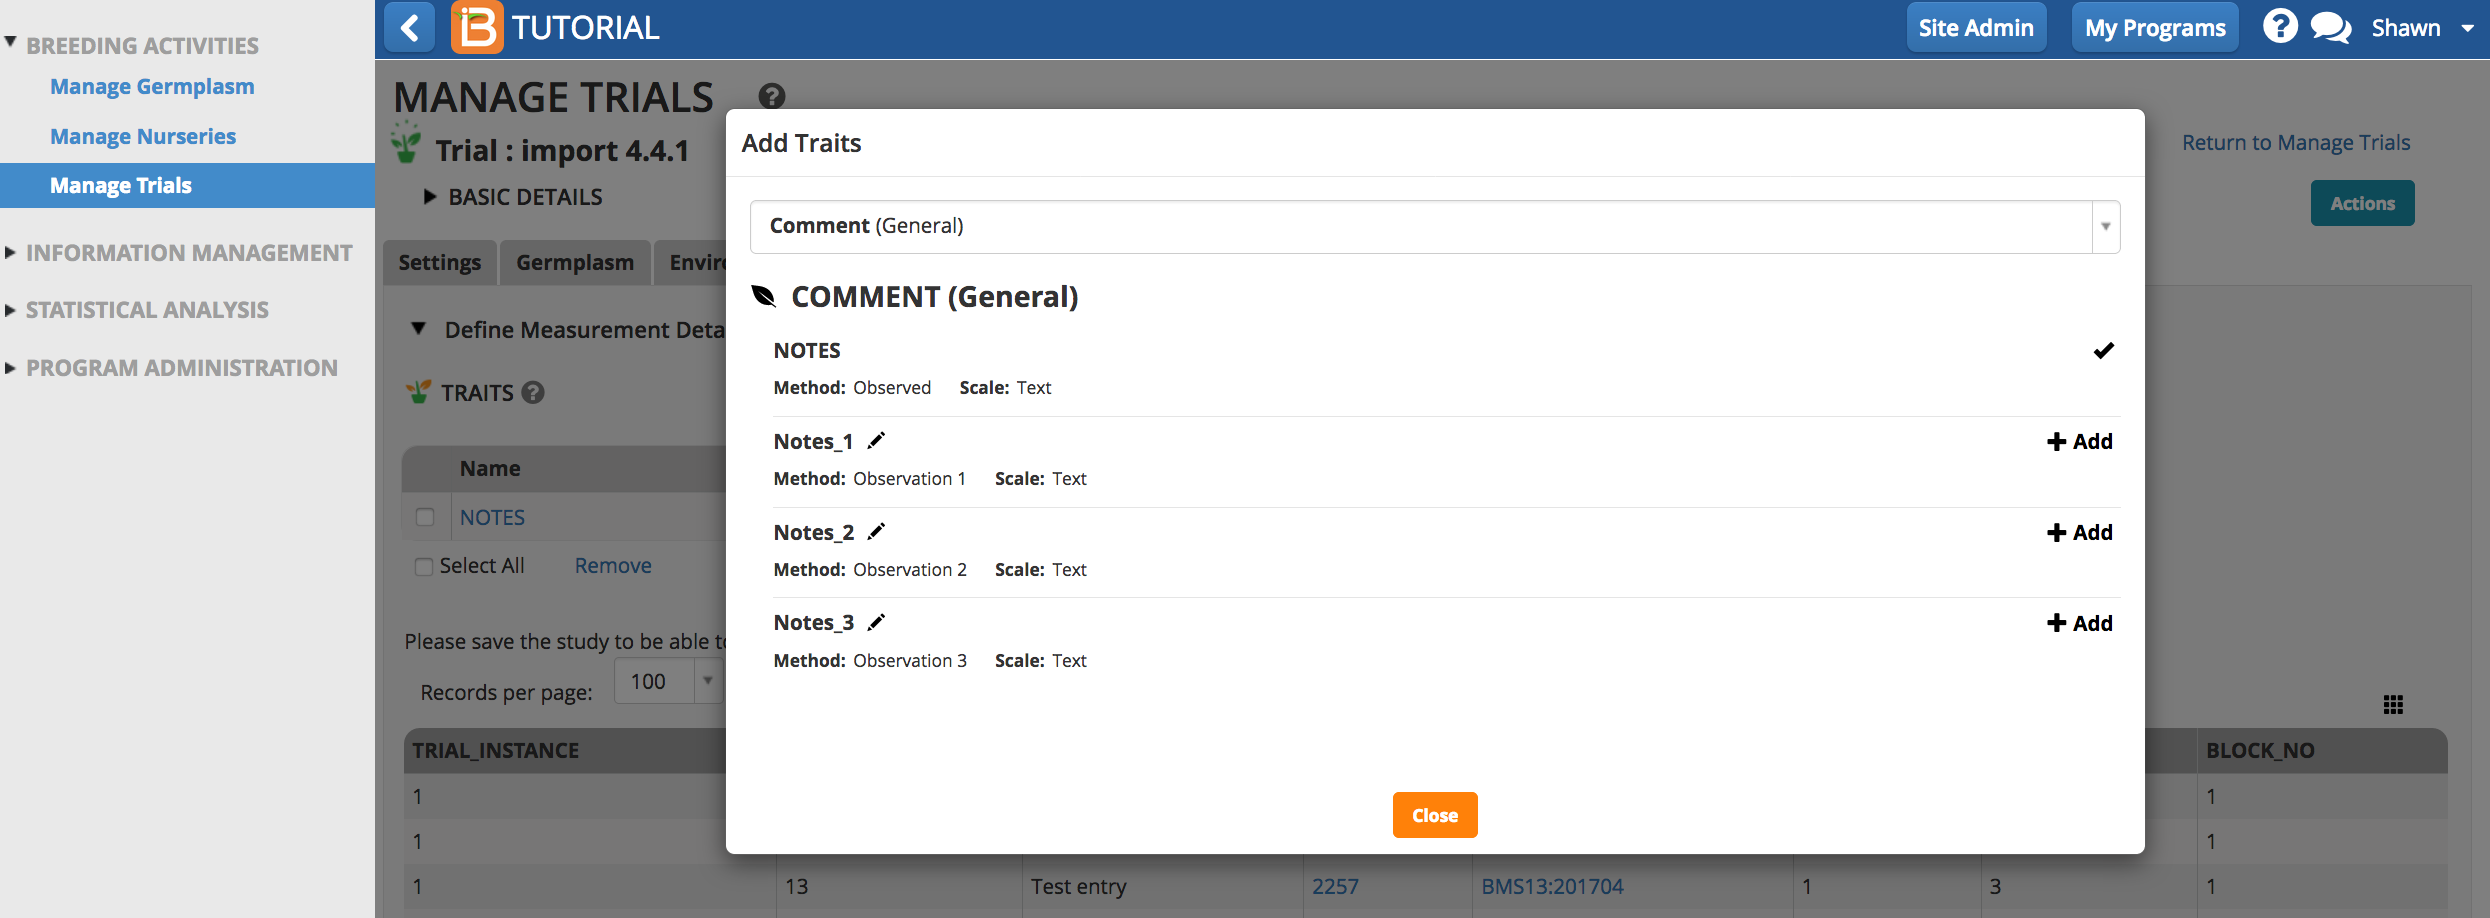
Traits and trait aliases are defined by the crop ontology. If you do not find a trait of interest from the drop down menu, see Manage Ontology for instructions on adding new traits. If the desired trait cannot be found, the new trait must be added to the crop ontology.
- Select the Add button to specify traits to measure, or the dependent variables. Type a word or part of a word that describes the trait that will be measured. You can search by name or the alias of the variable.
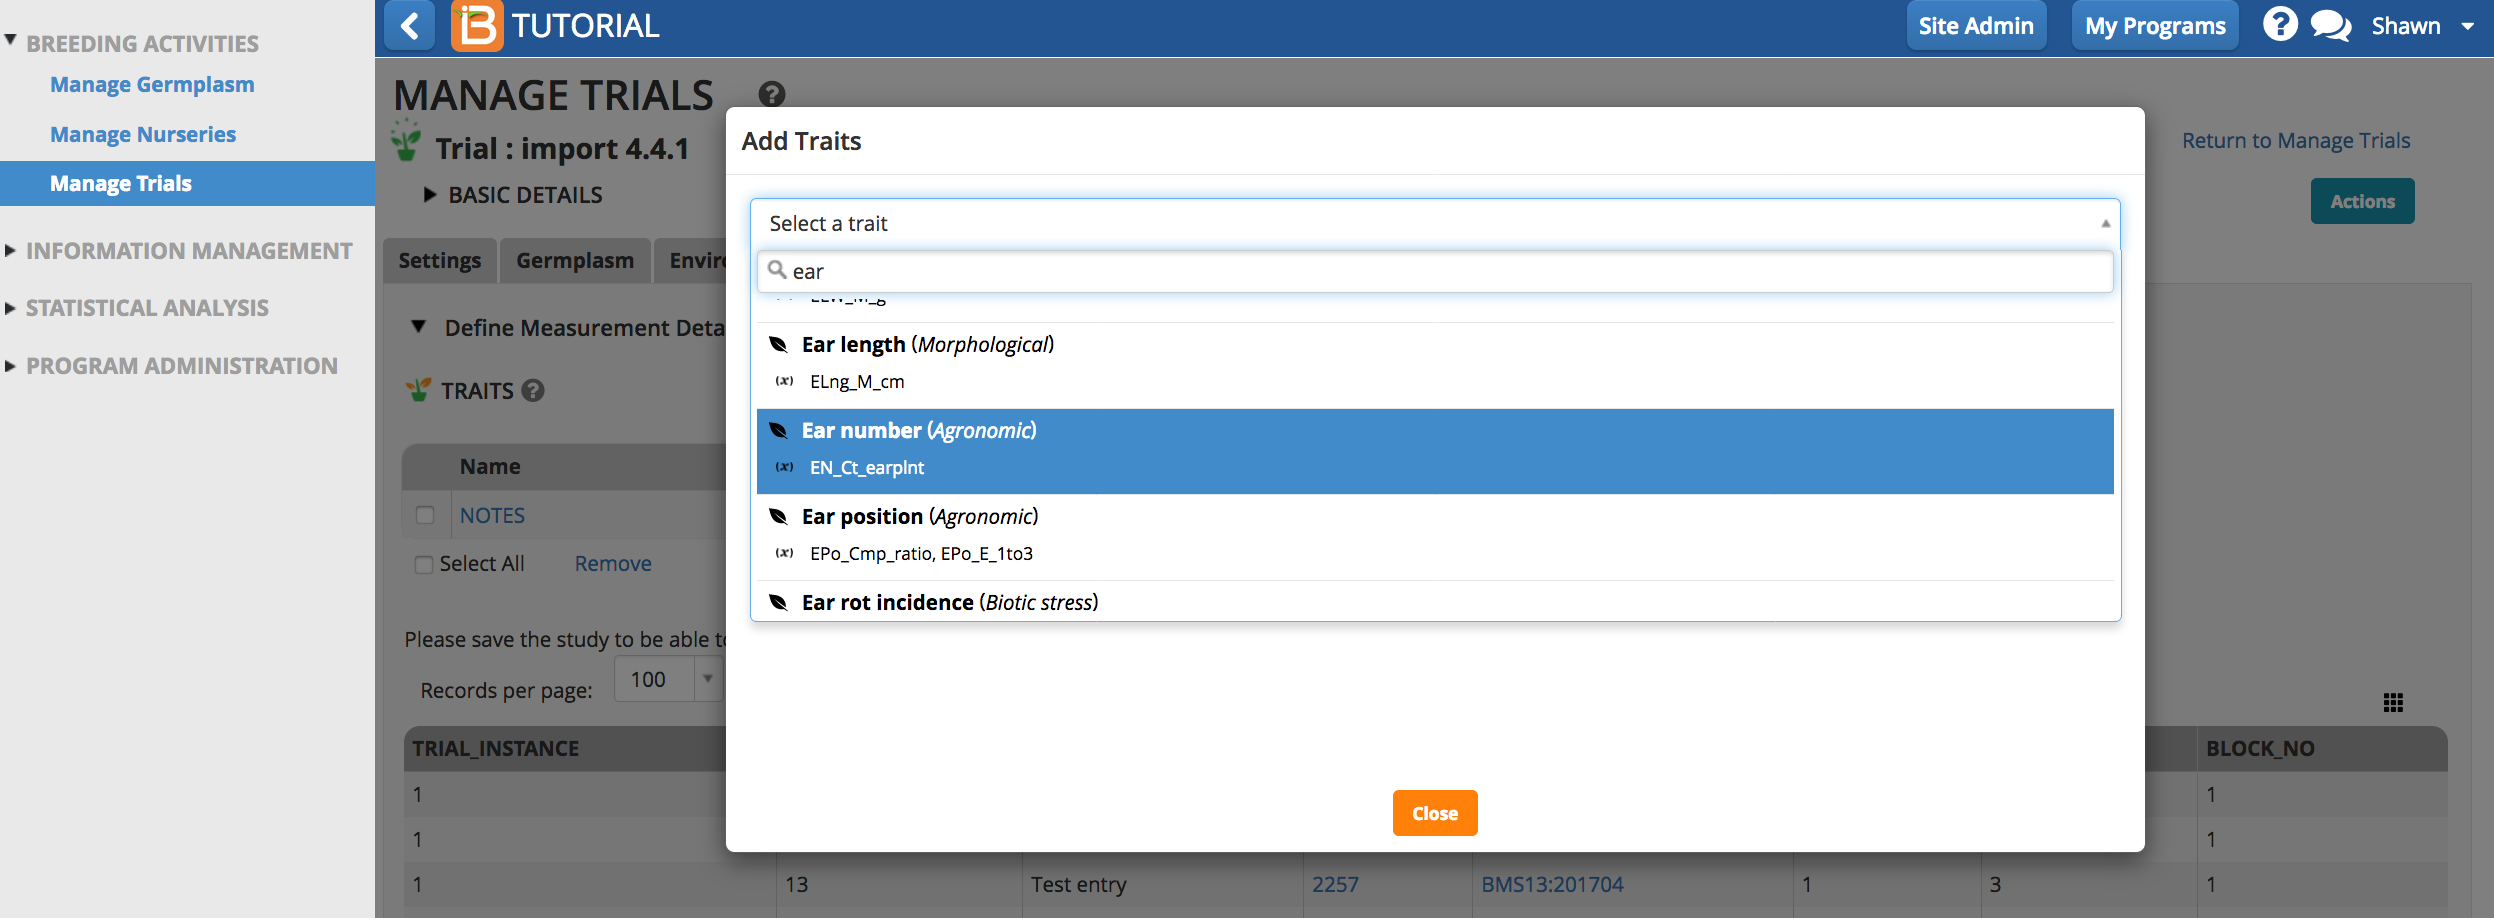
Once selected, the traits of interest will appear as an empty column of data in the measurements table.
The saved study is ready for (1) data collection or the creation of a (2) sub-observation dataset to record repeated measures.
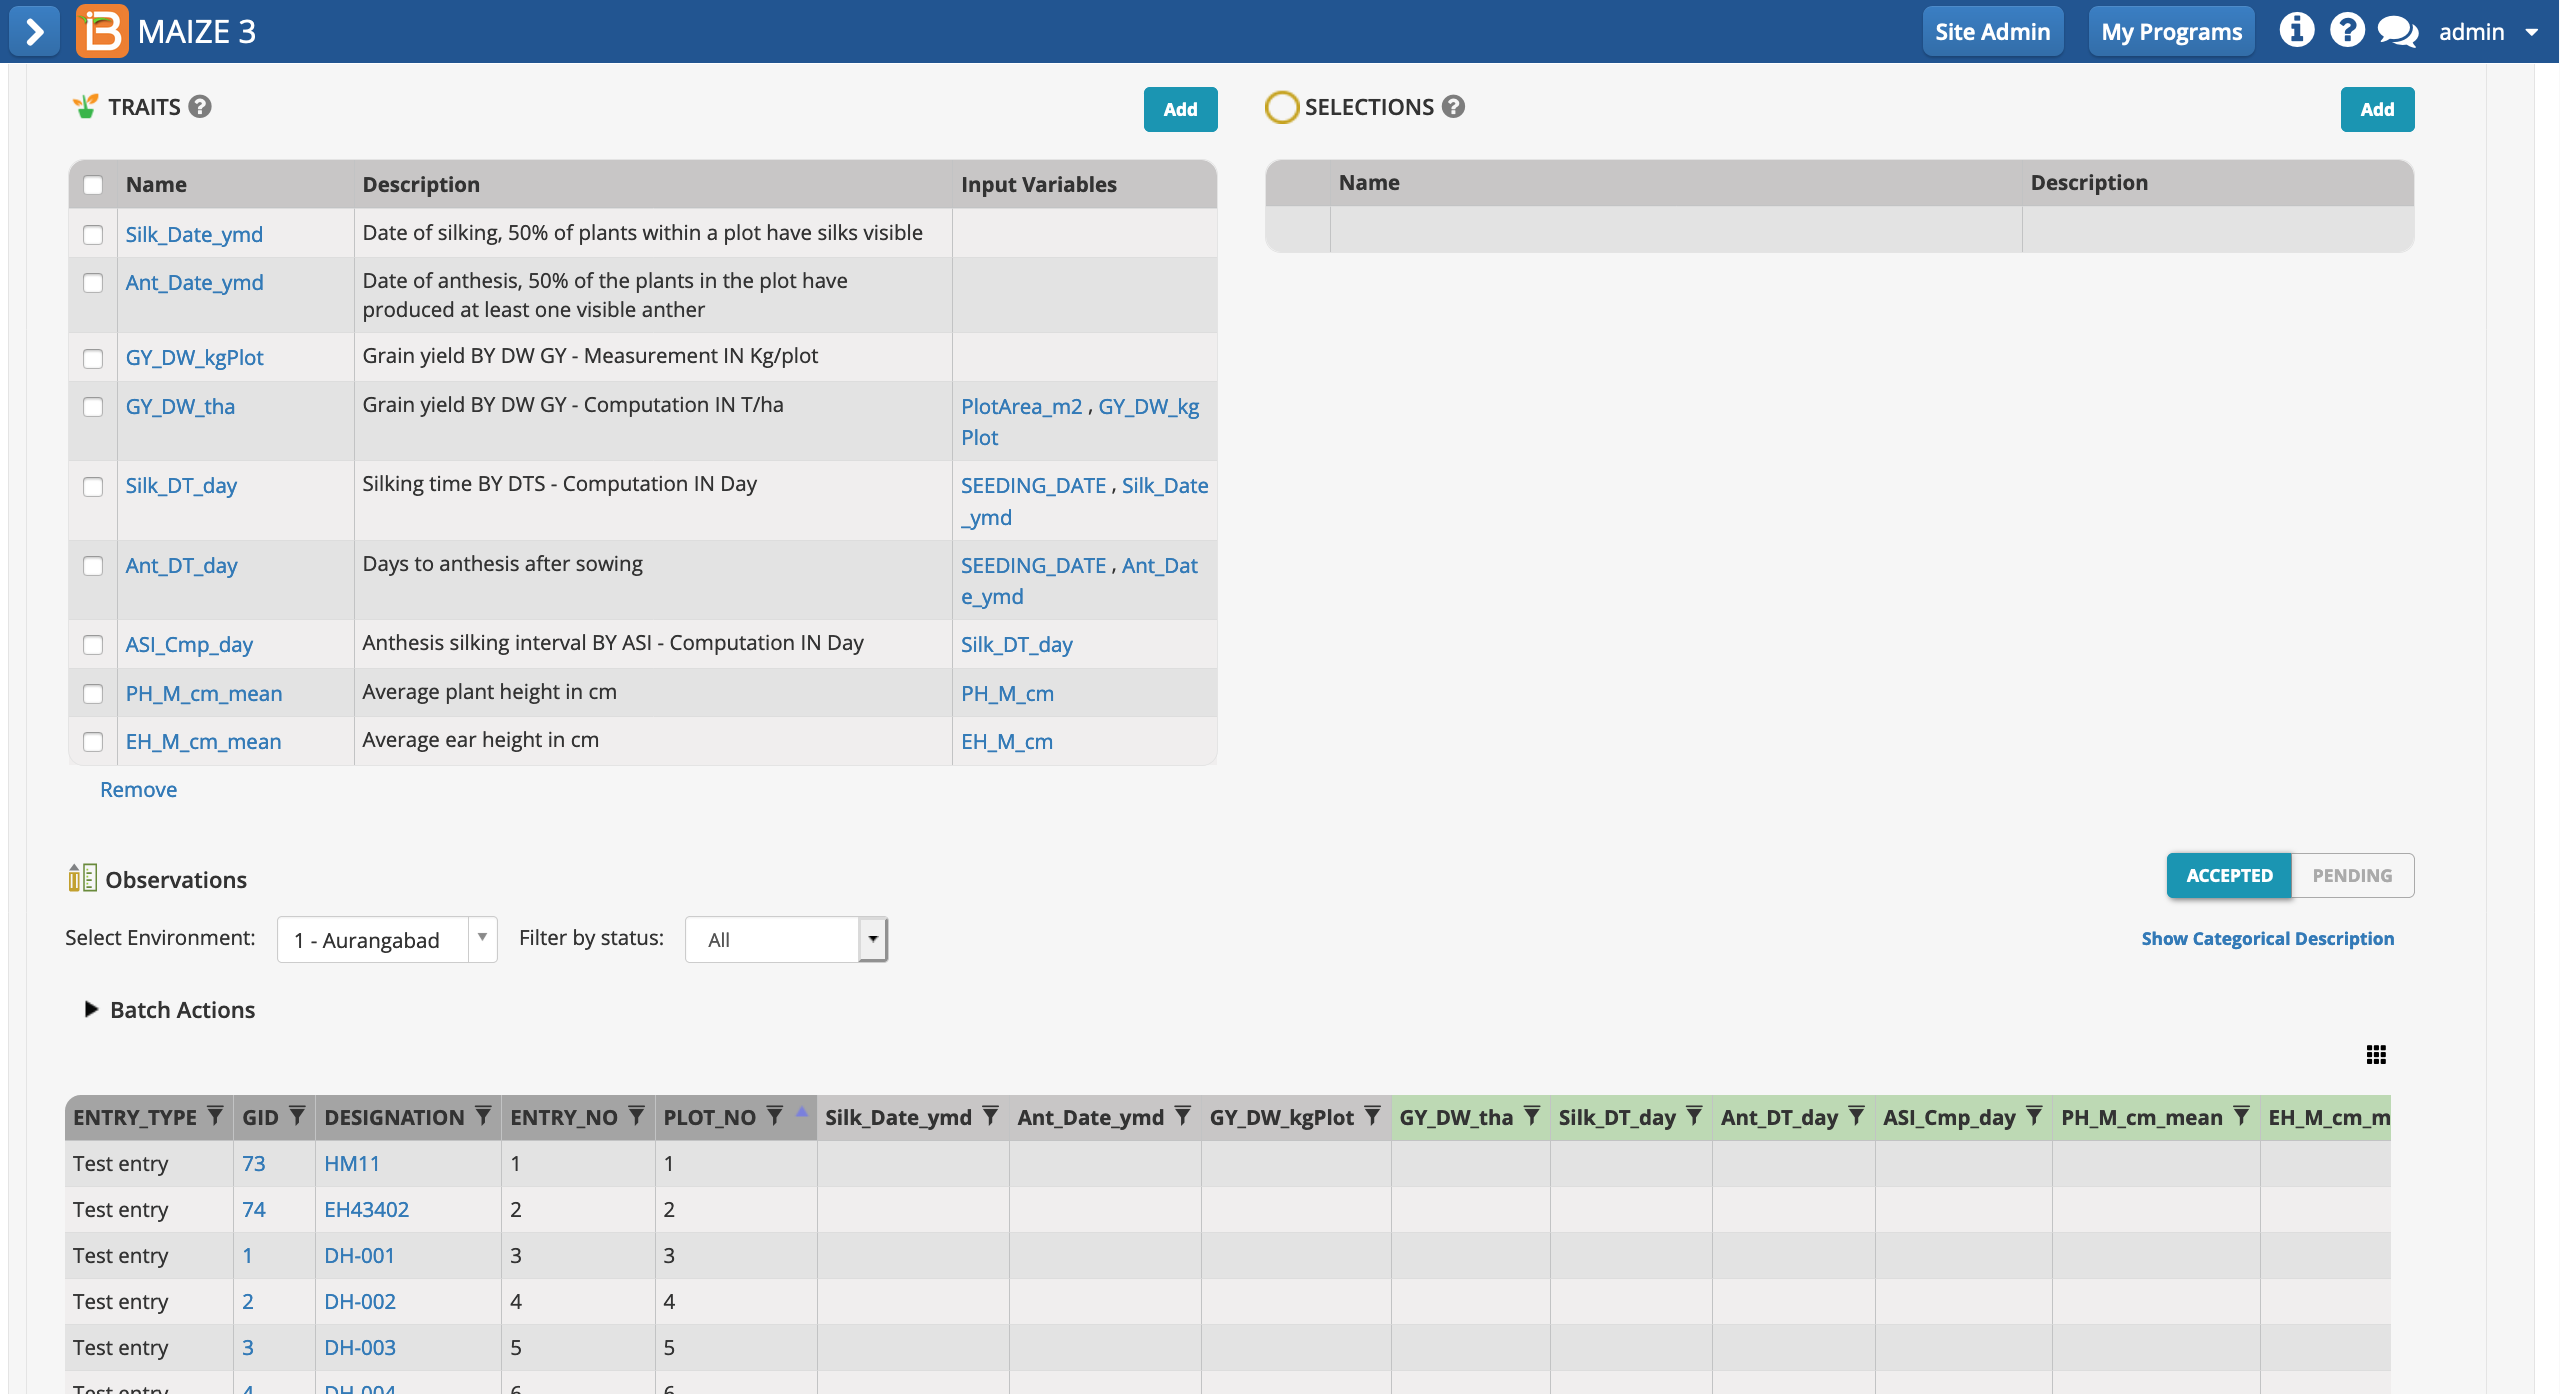
Add Selection
If you want to advance within plot selections a selection variate must be added to the study (see more on Advancement)
- Select Add Selections. Choose selection variate. Close popup.
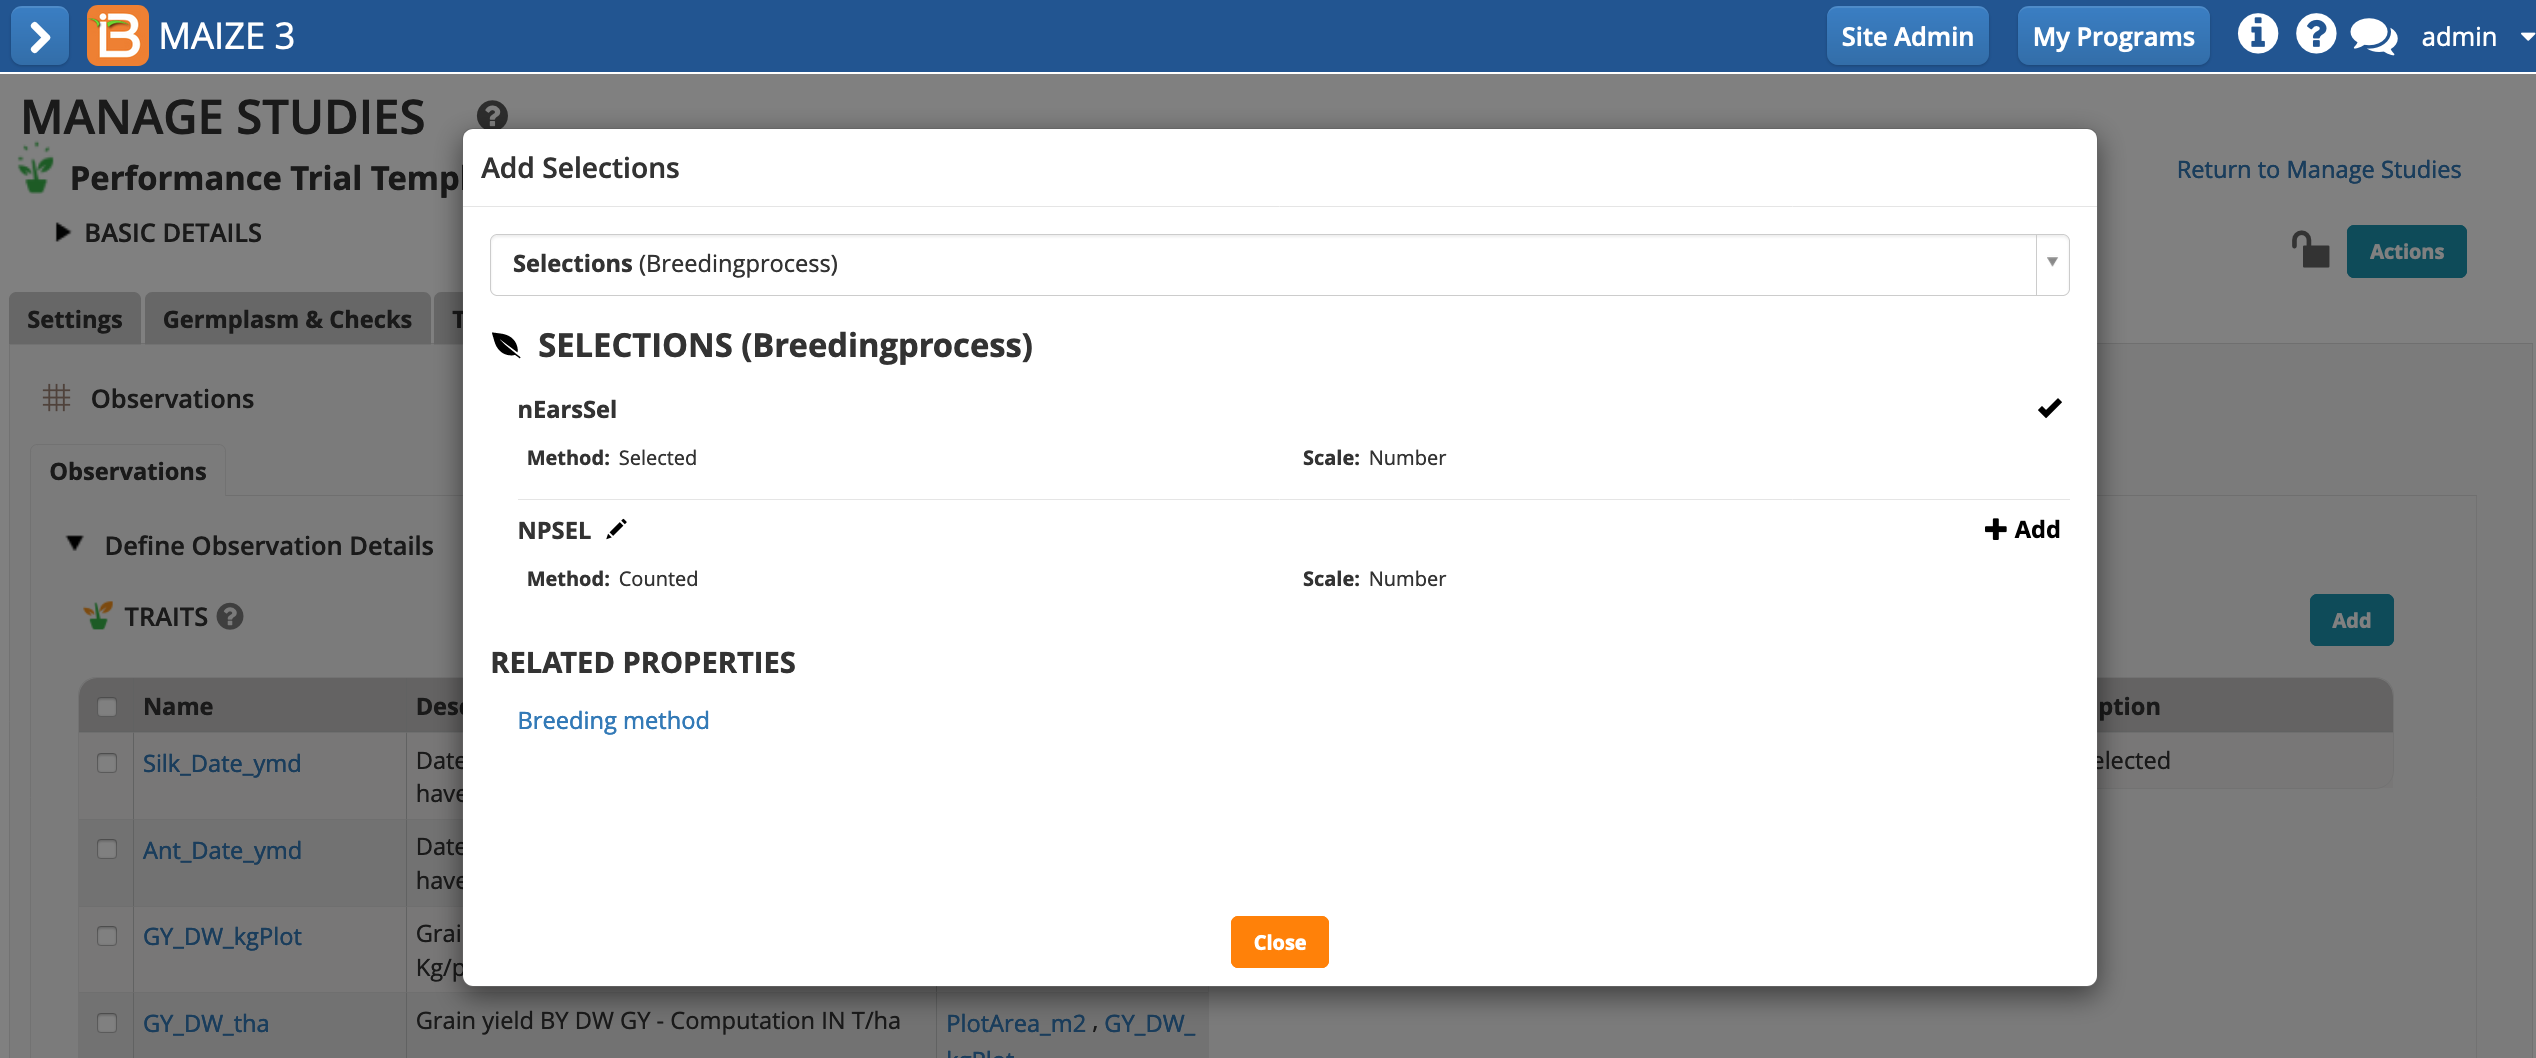
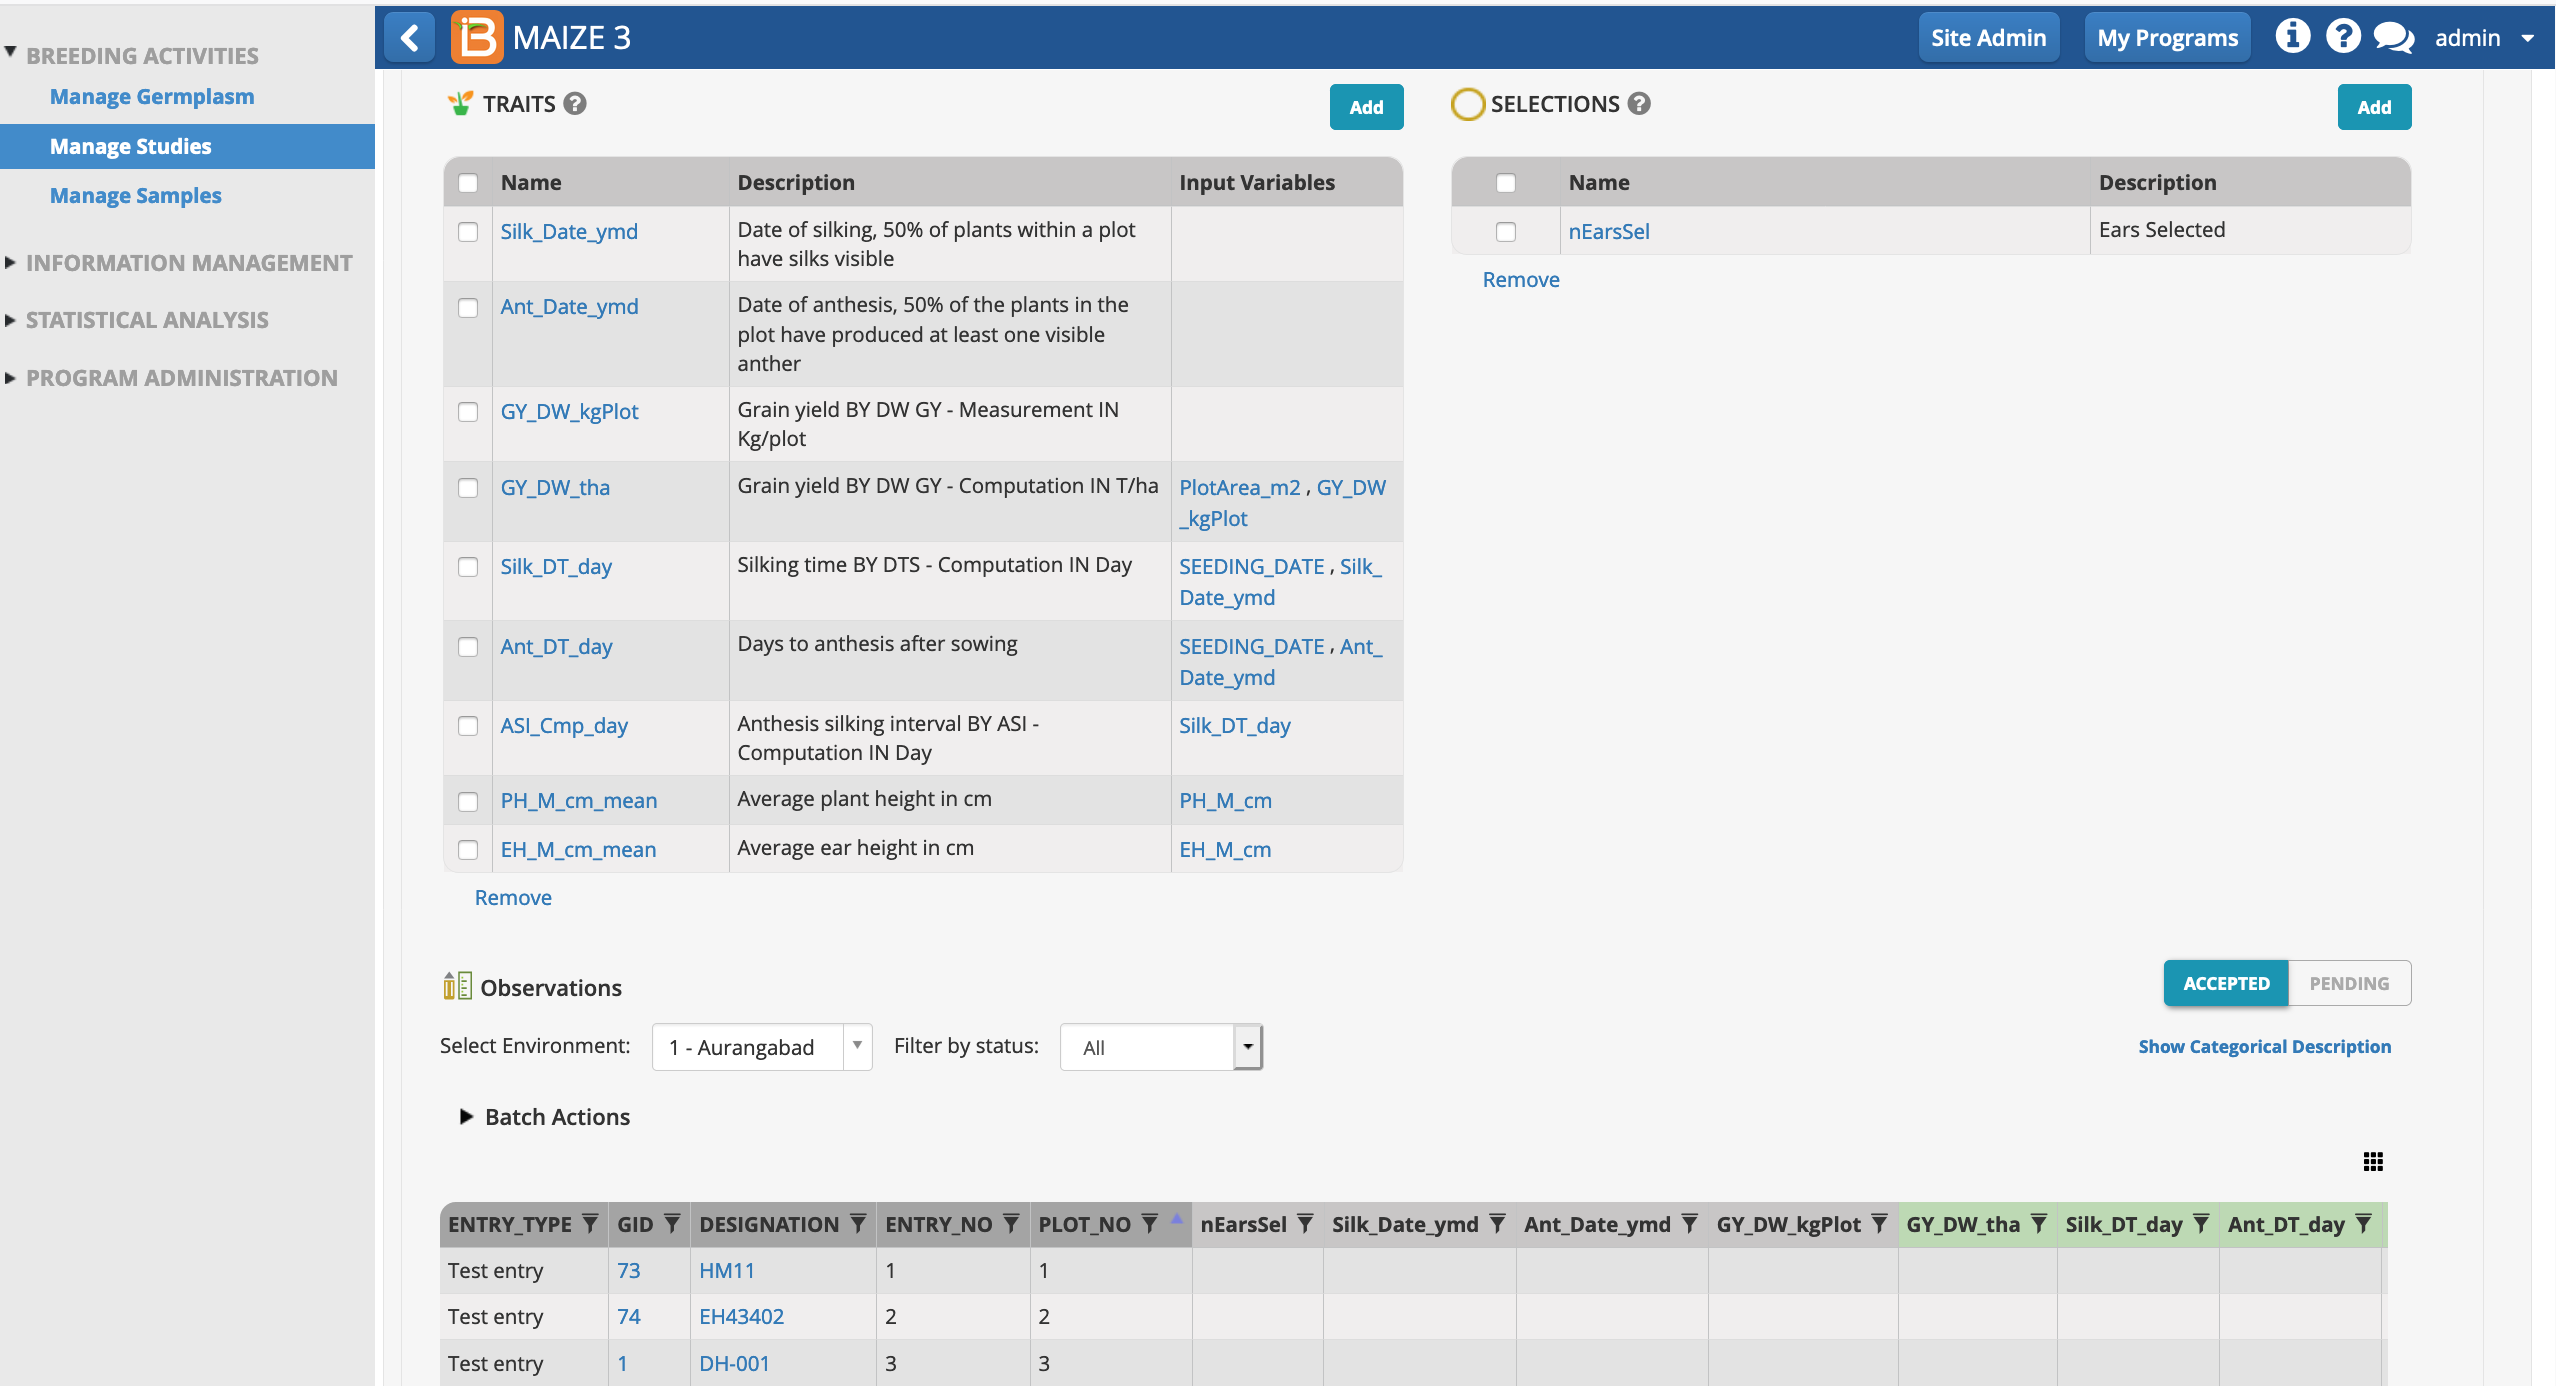
The selection variate is included as a column in the measurements table, and is ready to be filled with the number of ears selected from each plot.
Create Sub-Observation Unit Dataset
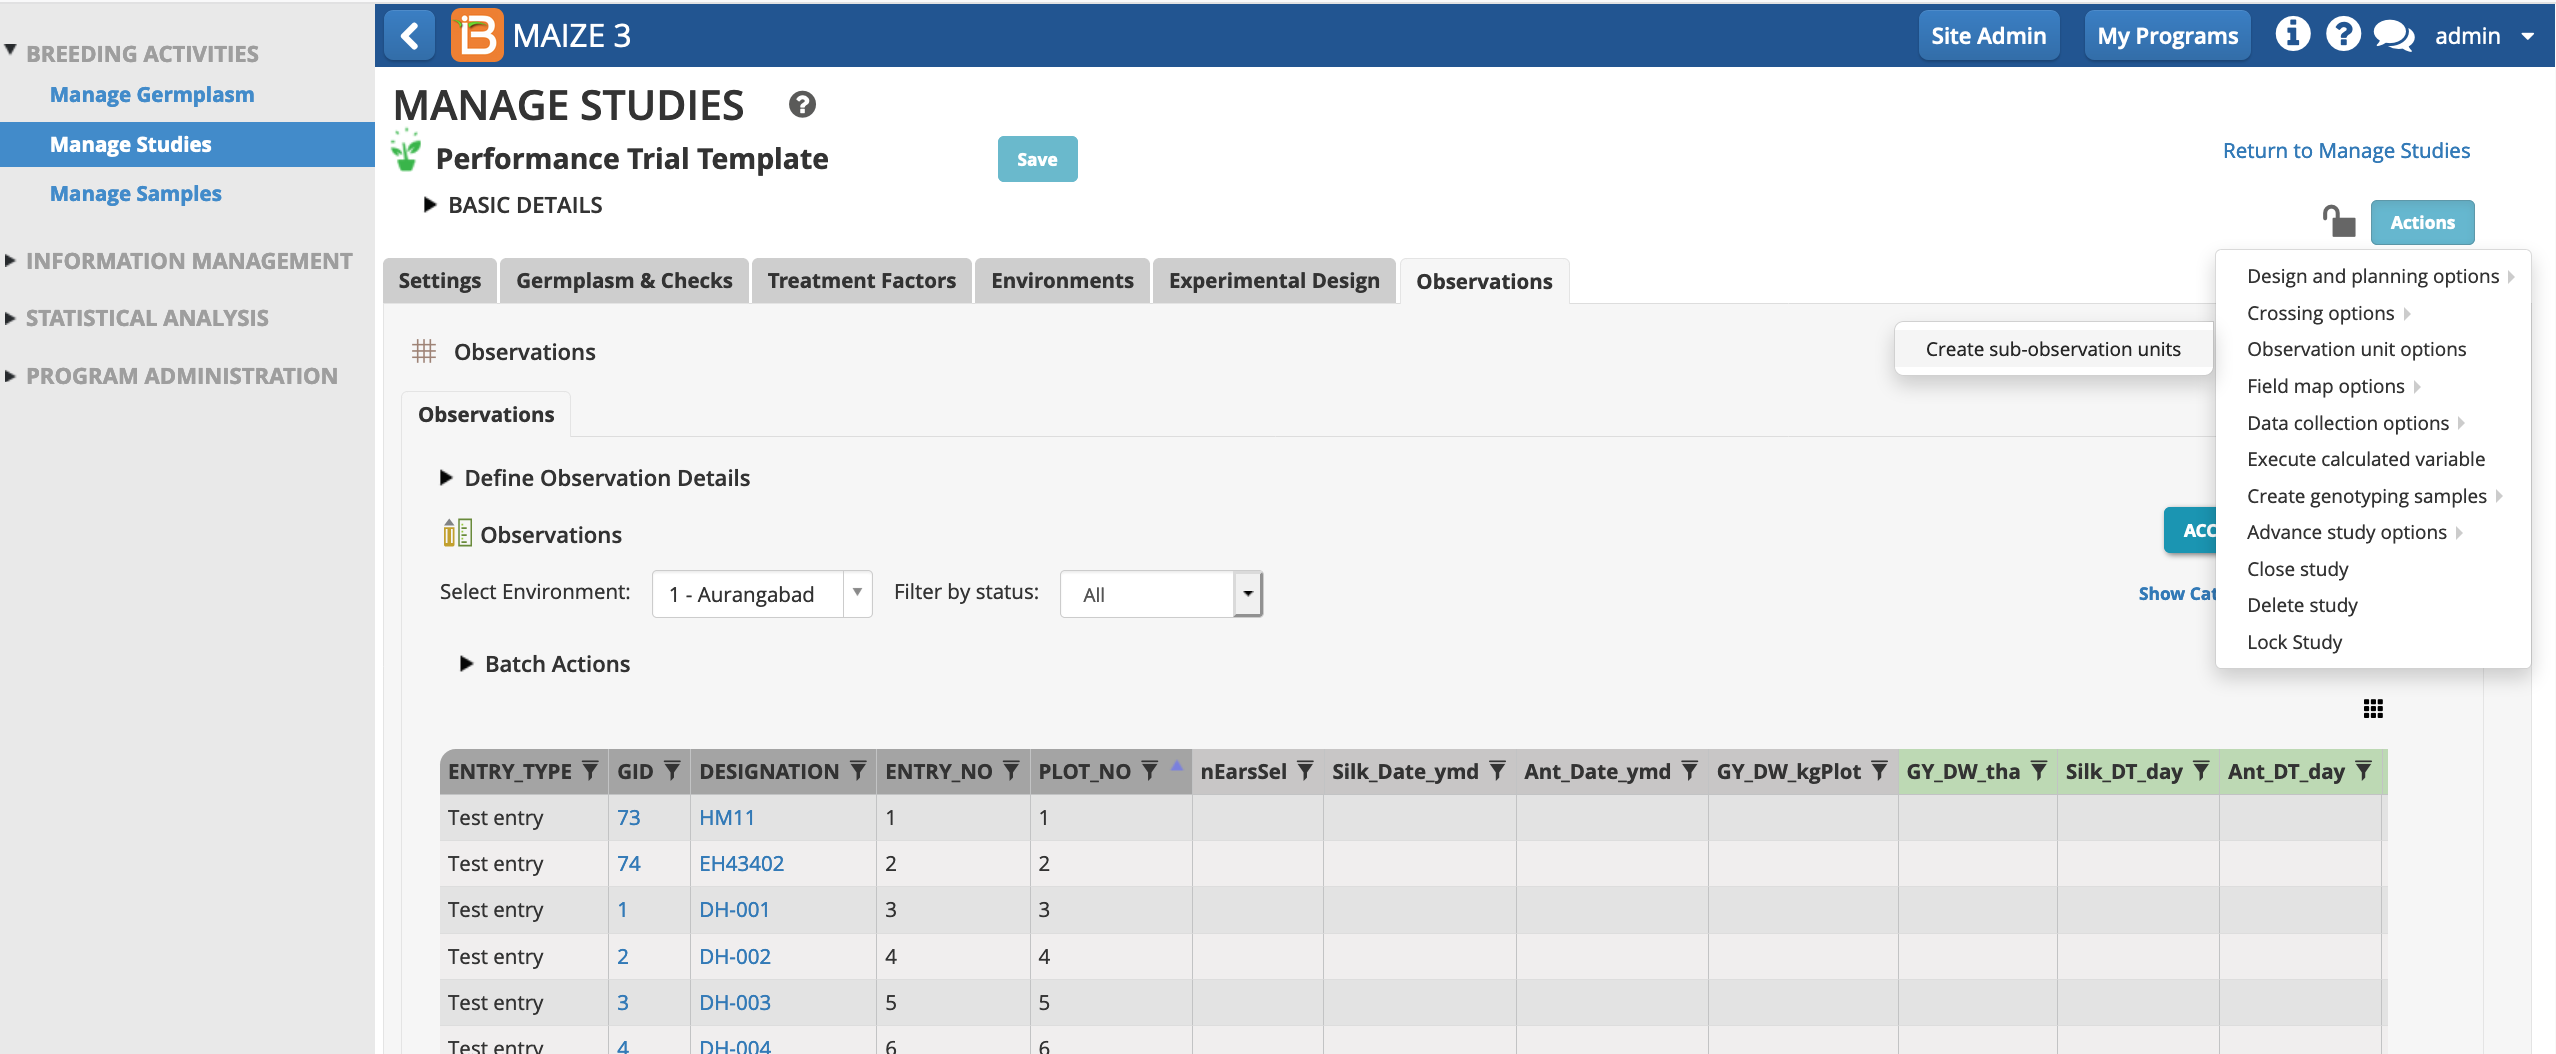
Once experimental design has been generated and the Observation table established, you are able to create additional data collection tables for repeated measures (sub-observations units).
Common repeated measures include:
- Measure individual plants within a plot
- Measure different quadrats within a plot
- Measure the same trait at multiple time points - Beta
- Create sub-observation units to take repeated measures.
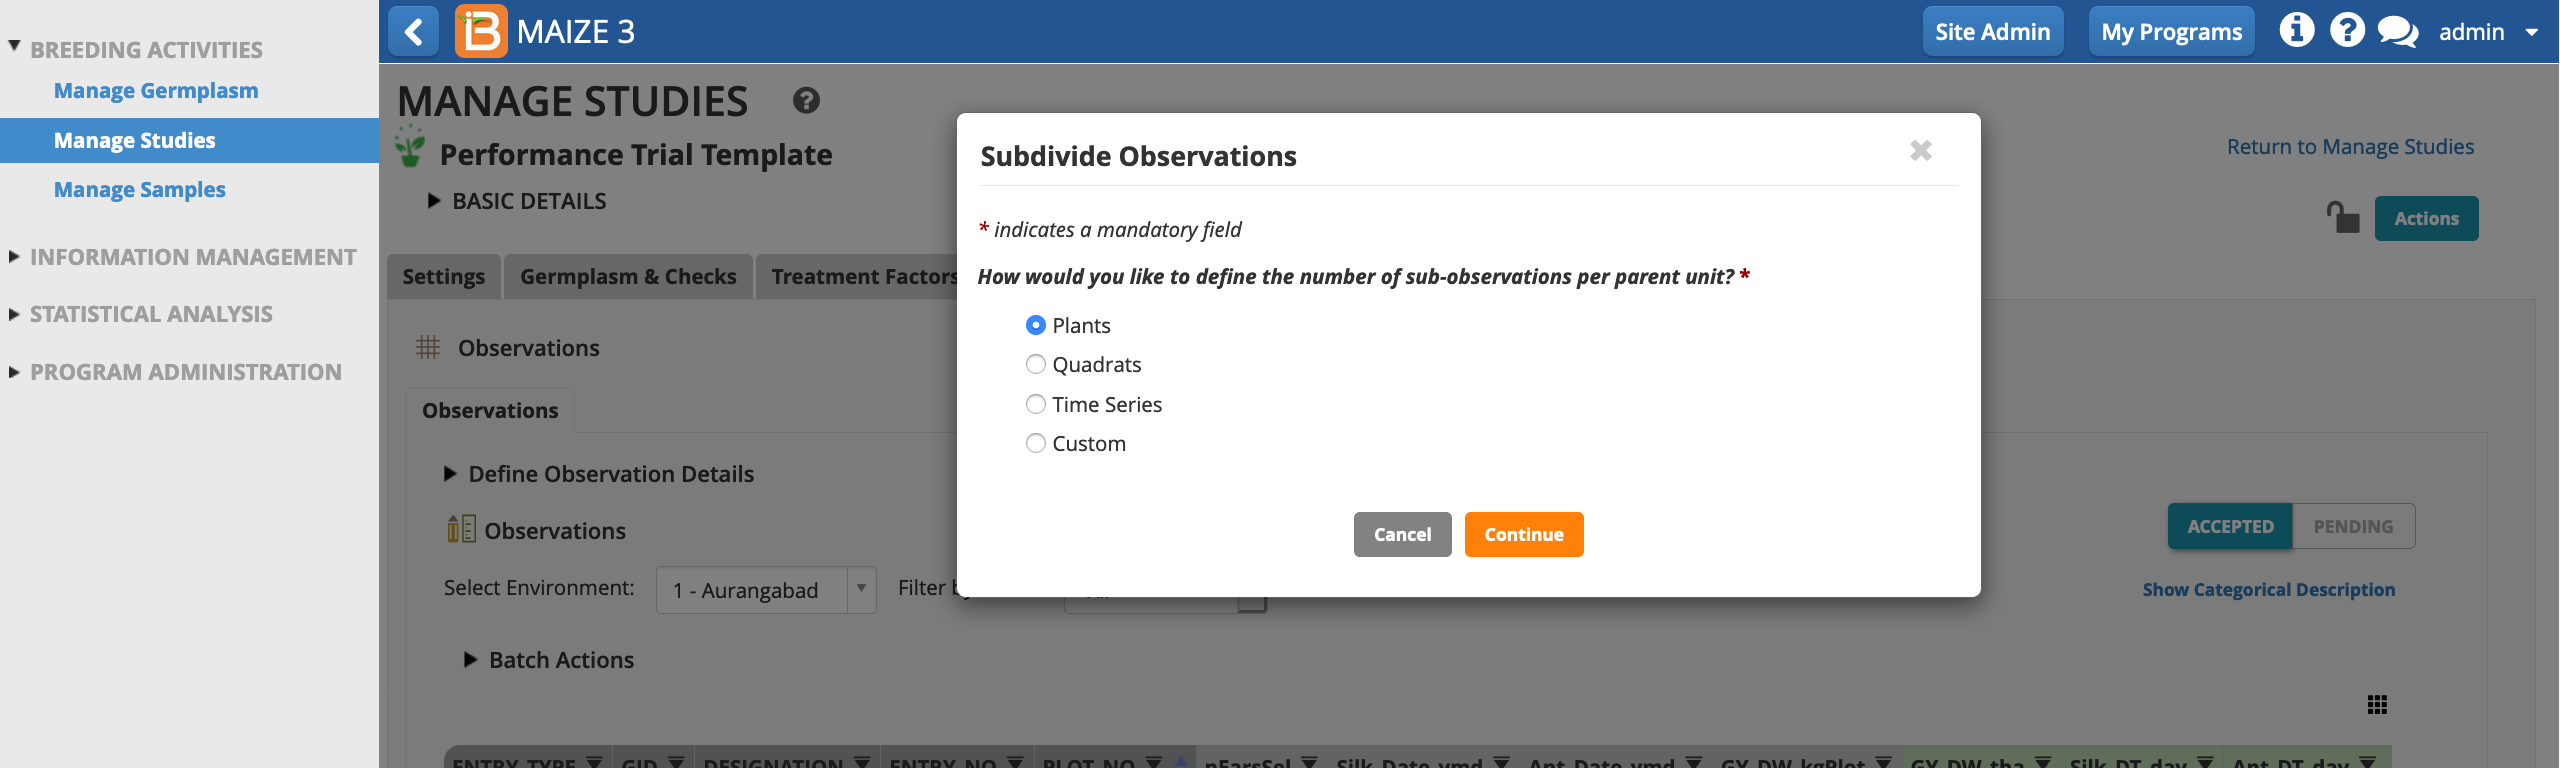
Define Sub-Observation Units
Example Plant Sub-Sampling
In the following example, a maize breeder is planning to measure the height of 5 plants per plot at maturity.
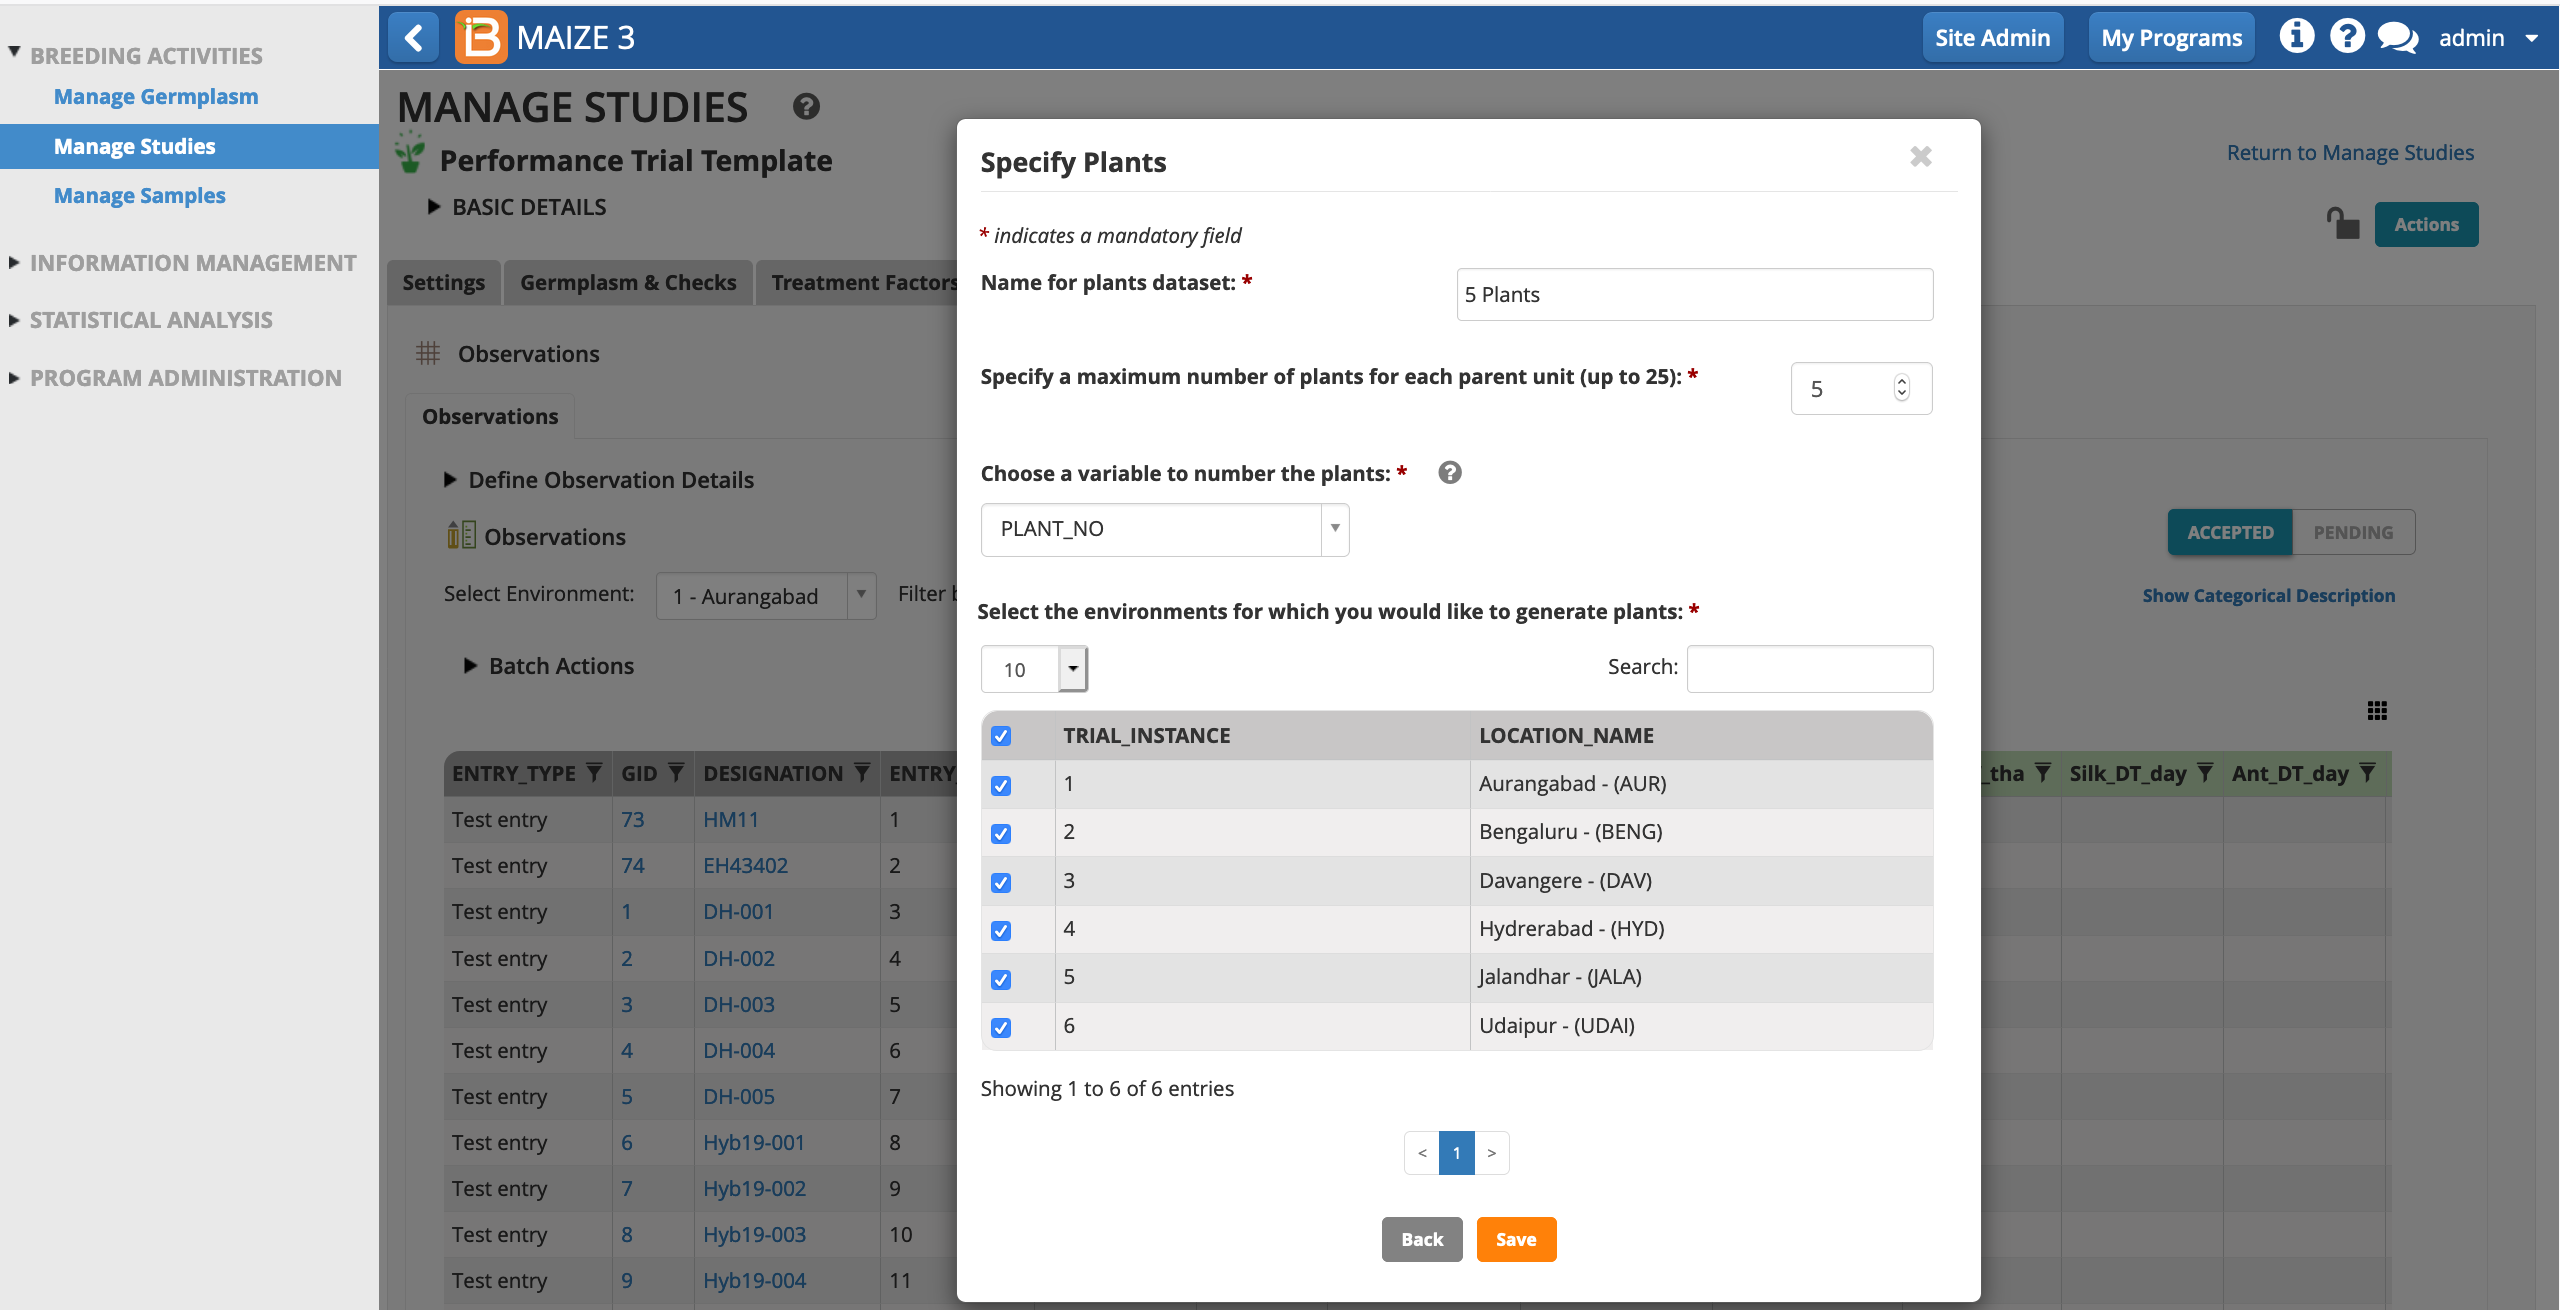
- Select Plants as the sub-observation units.
- Give the sub-observation data set a unique name. Specify 5 plants per plot. Leave PLANT_NO as the default numbering variable. Choose to sub-sample all study locations and Save.
- Select Add to add plant level trait details.
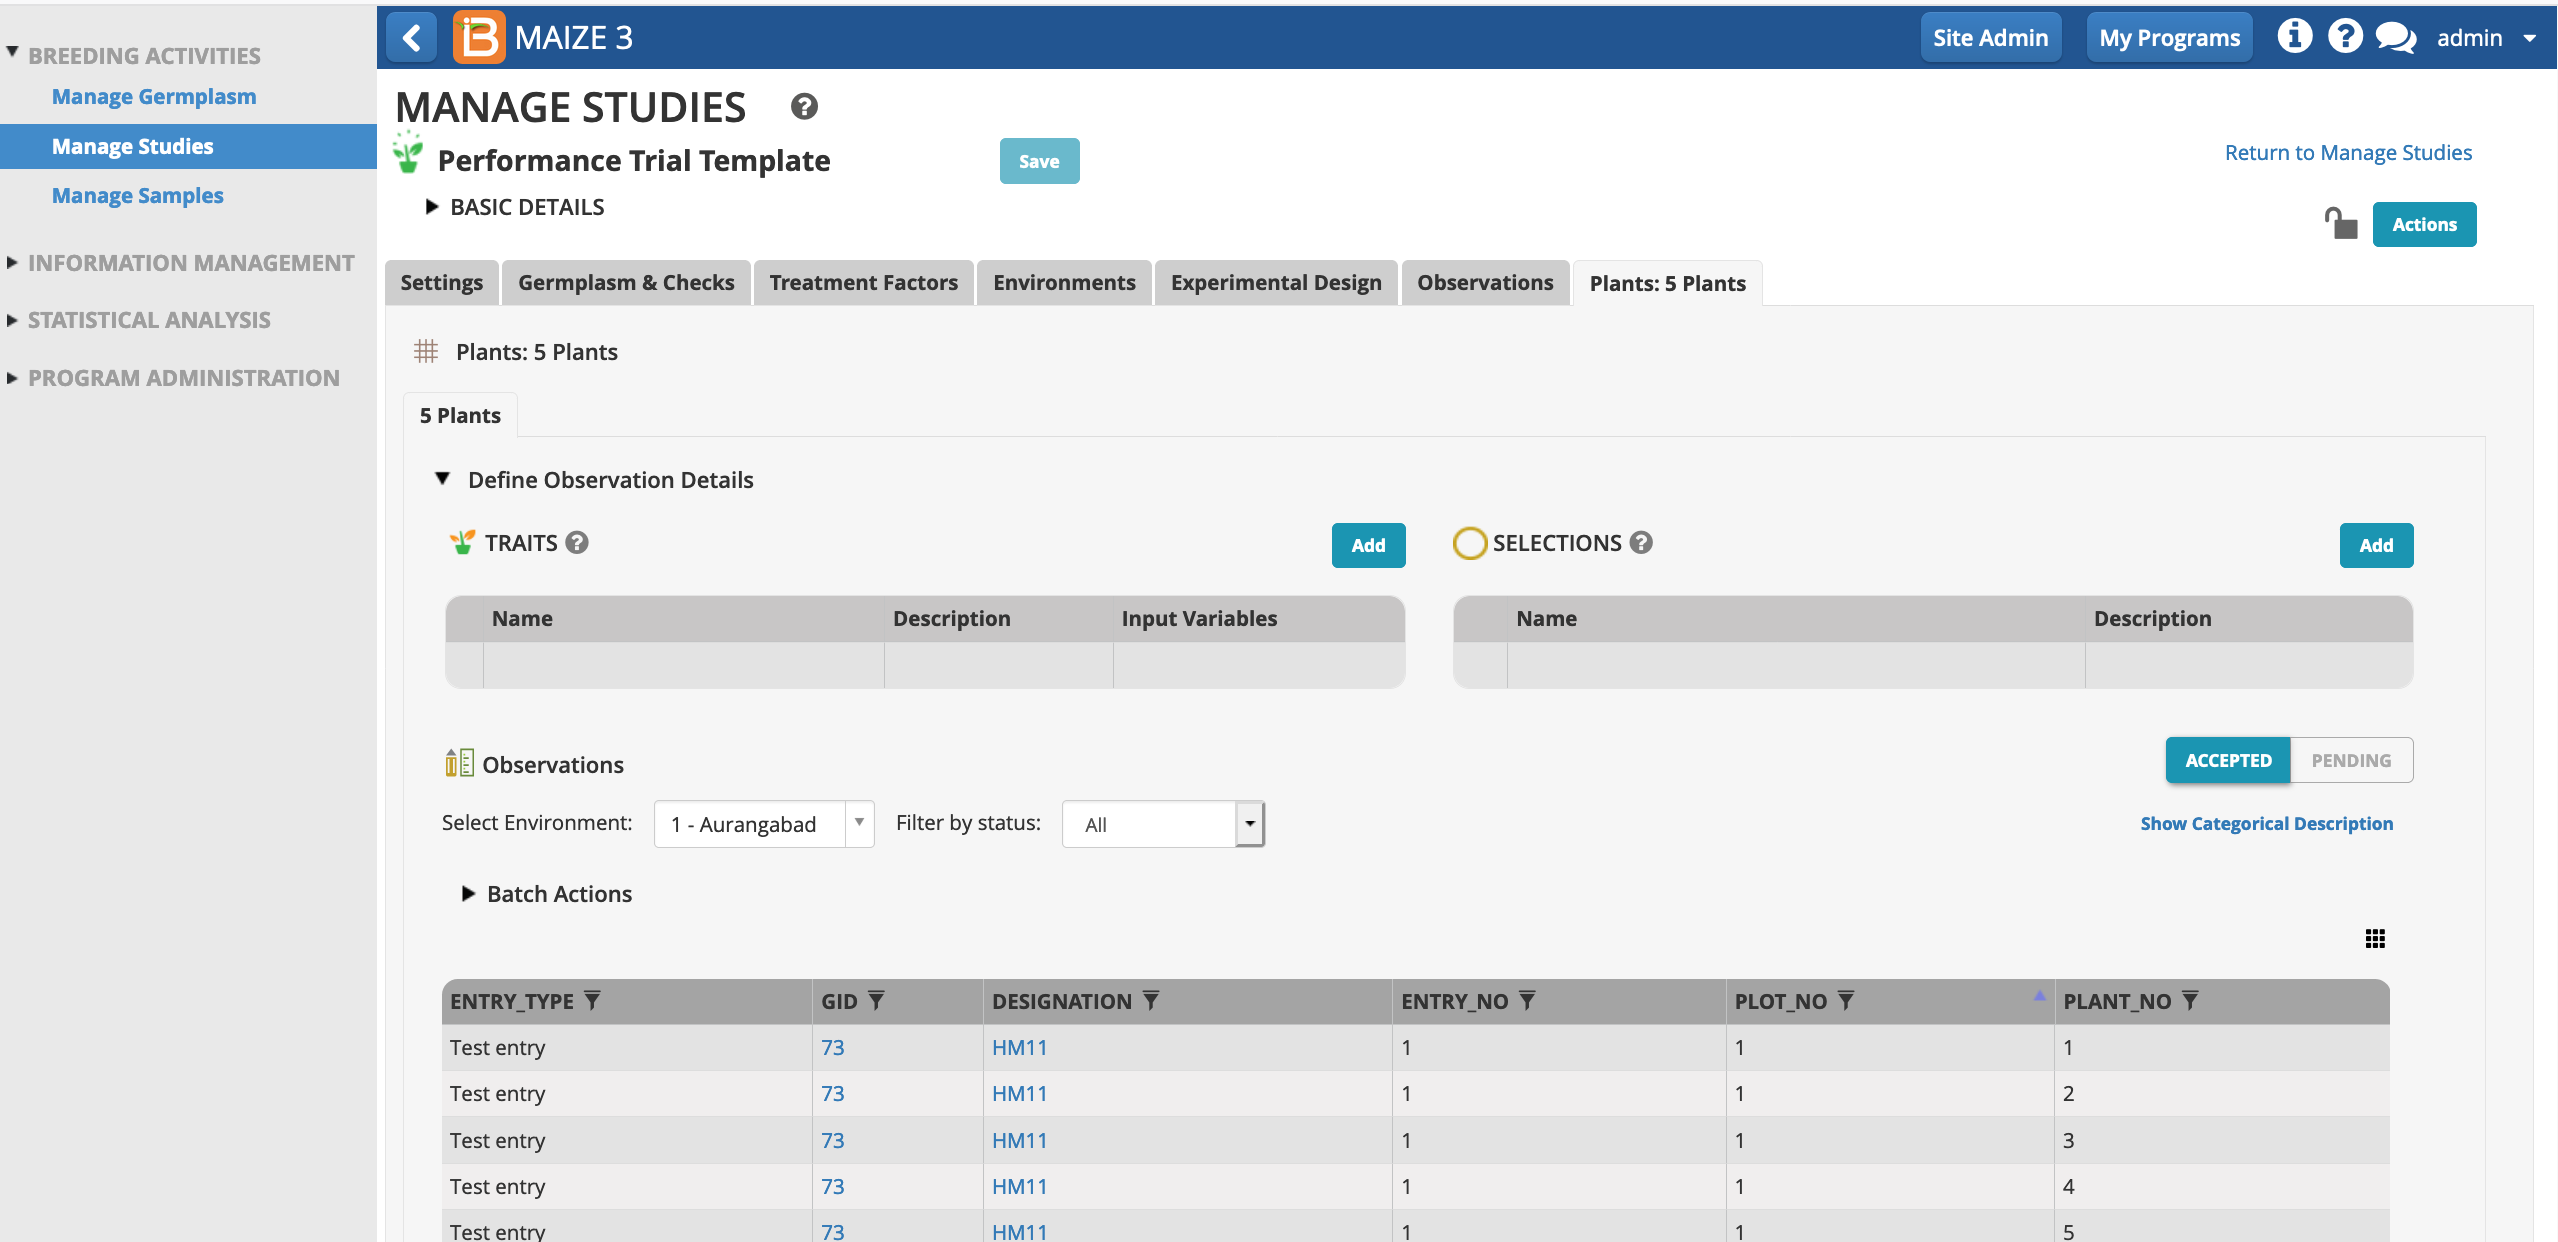
Each plot now contains 5 rows corresponding to 5 plants per plot.- Select the traits and/or selection variables of interest to include as columns in the sub-observation dataset.
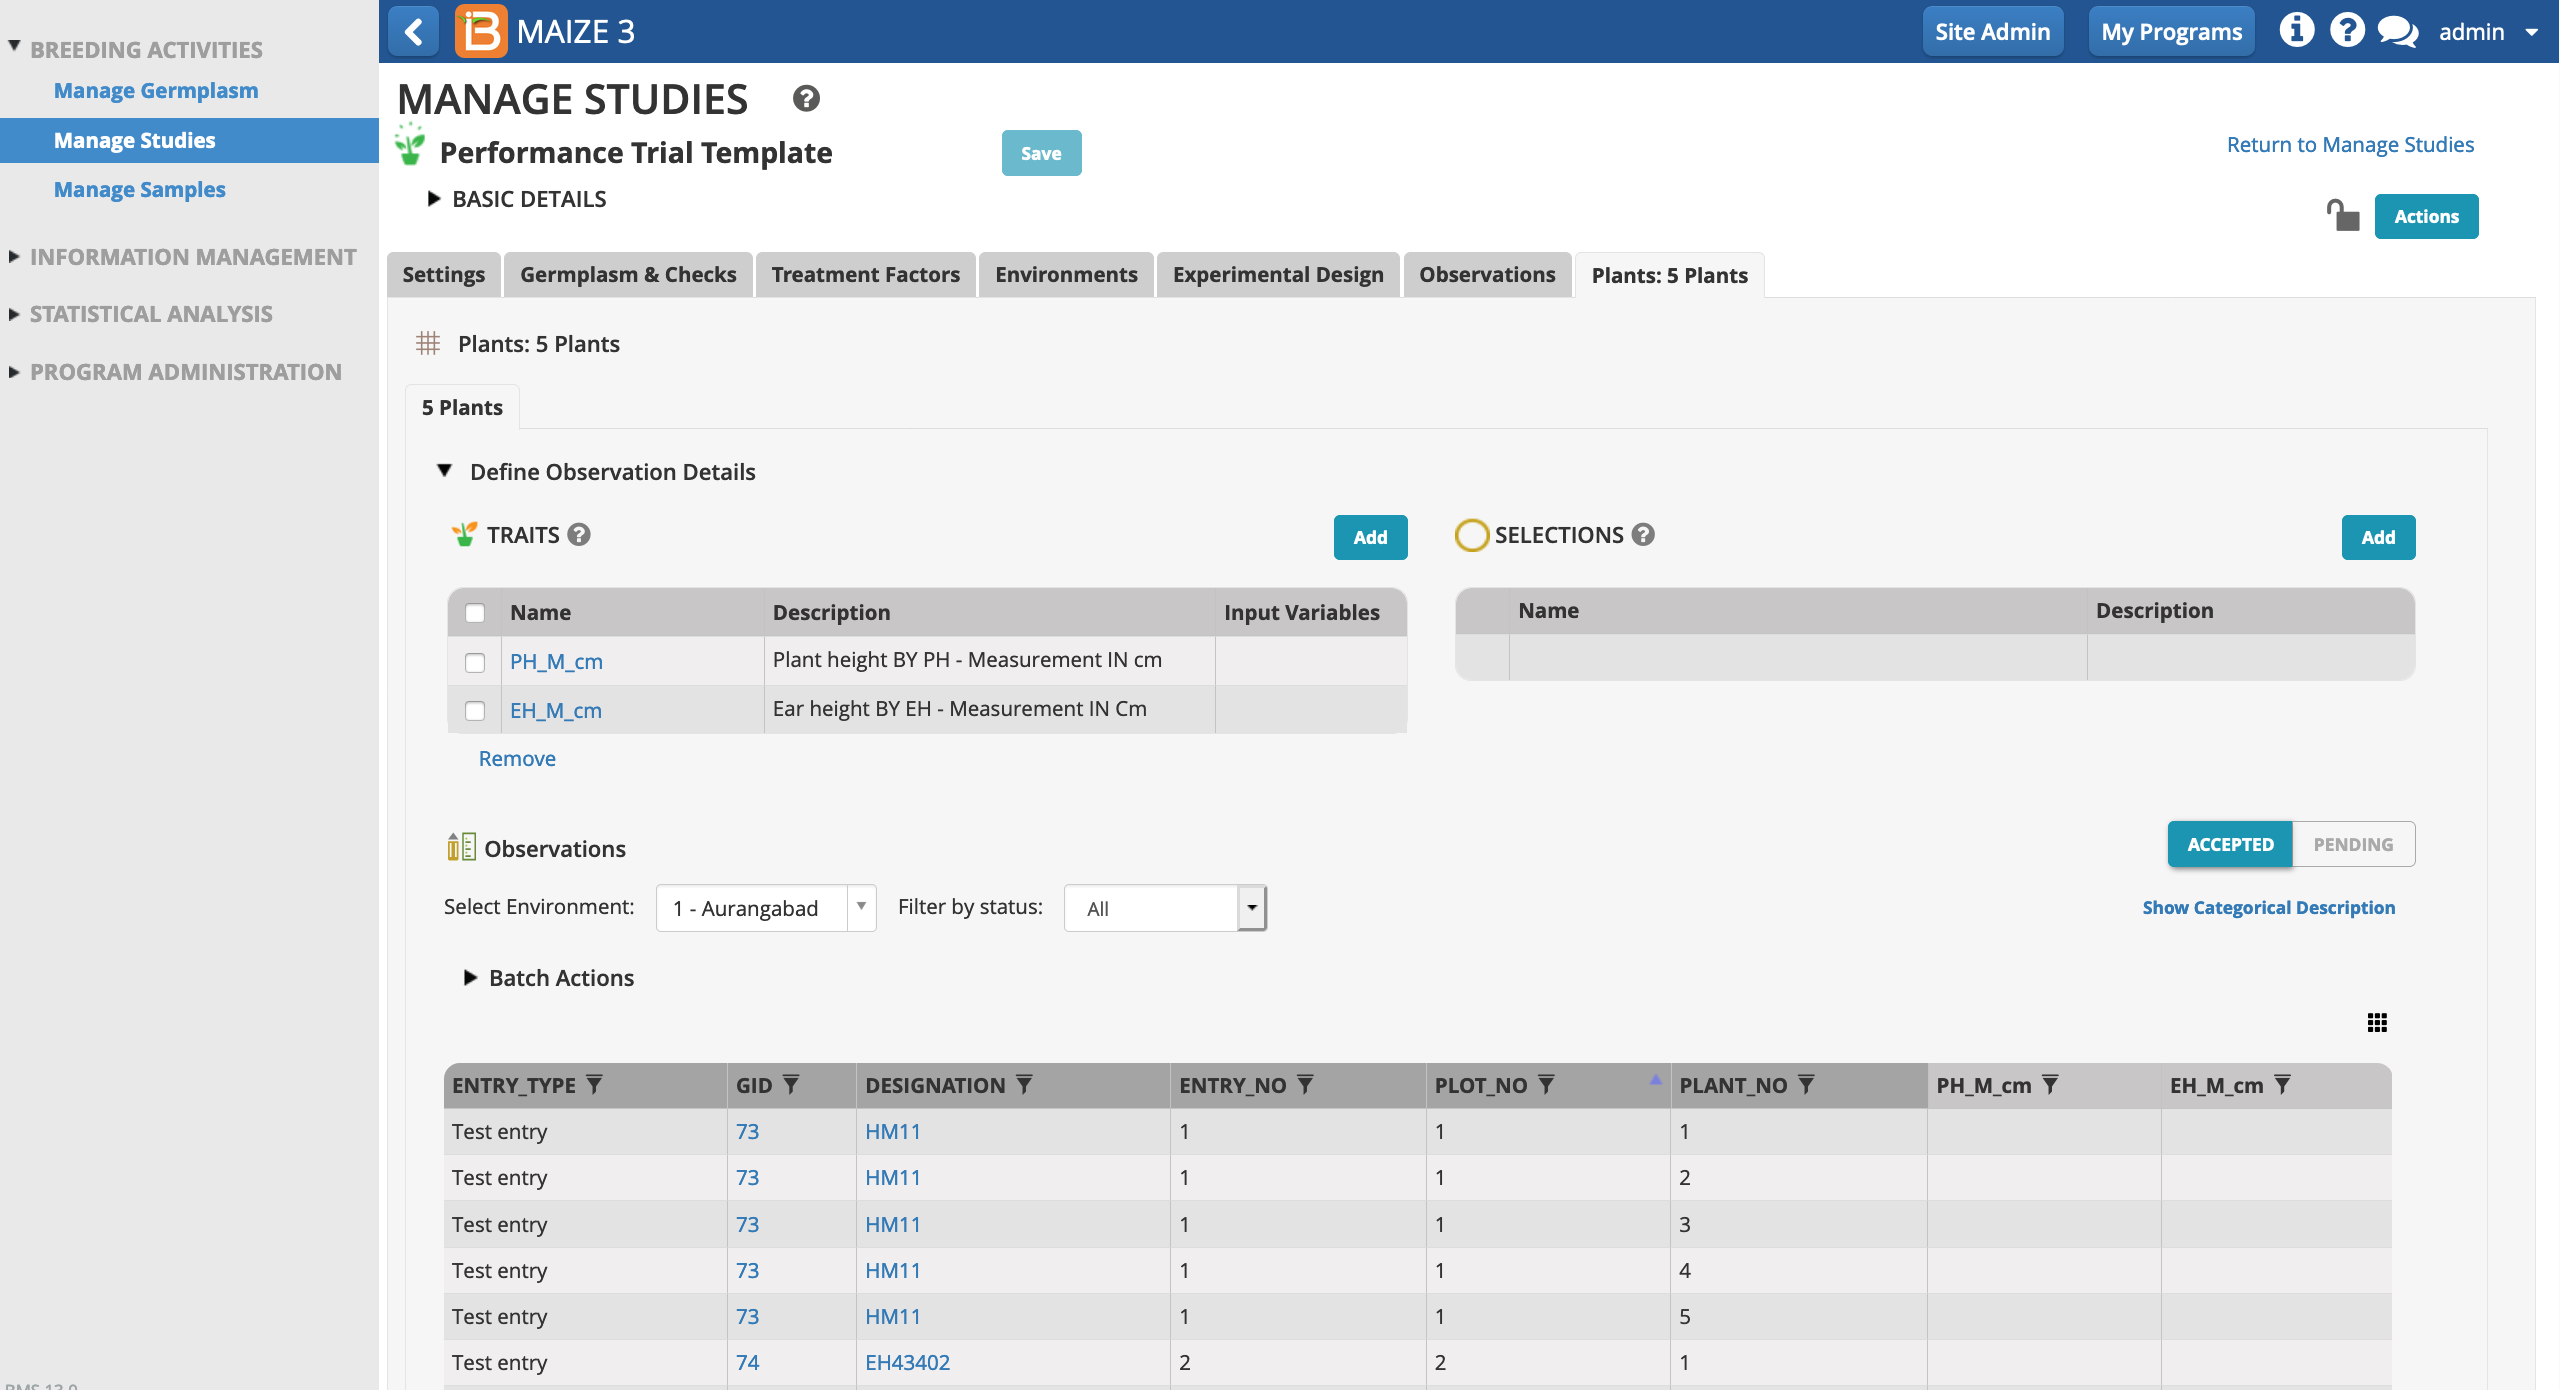
In this sub-observation dataset plant and ear heights (cm) will be measured from 5 representative plants in each plot. Each plant in the sub-observation dataset receives a unique OBS_UNIT_ID (see above for more info) suitable for barcoding individual plants within the plot.Example Custom Sub-Sampling
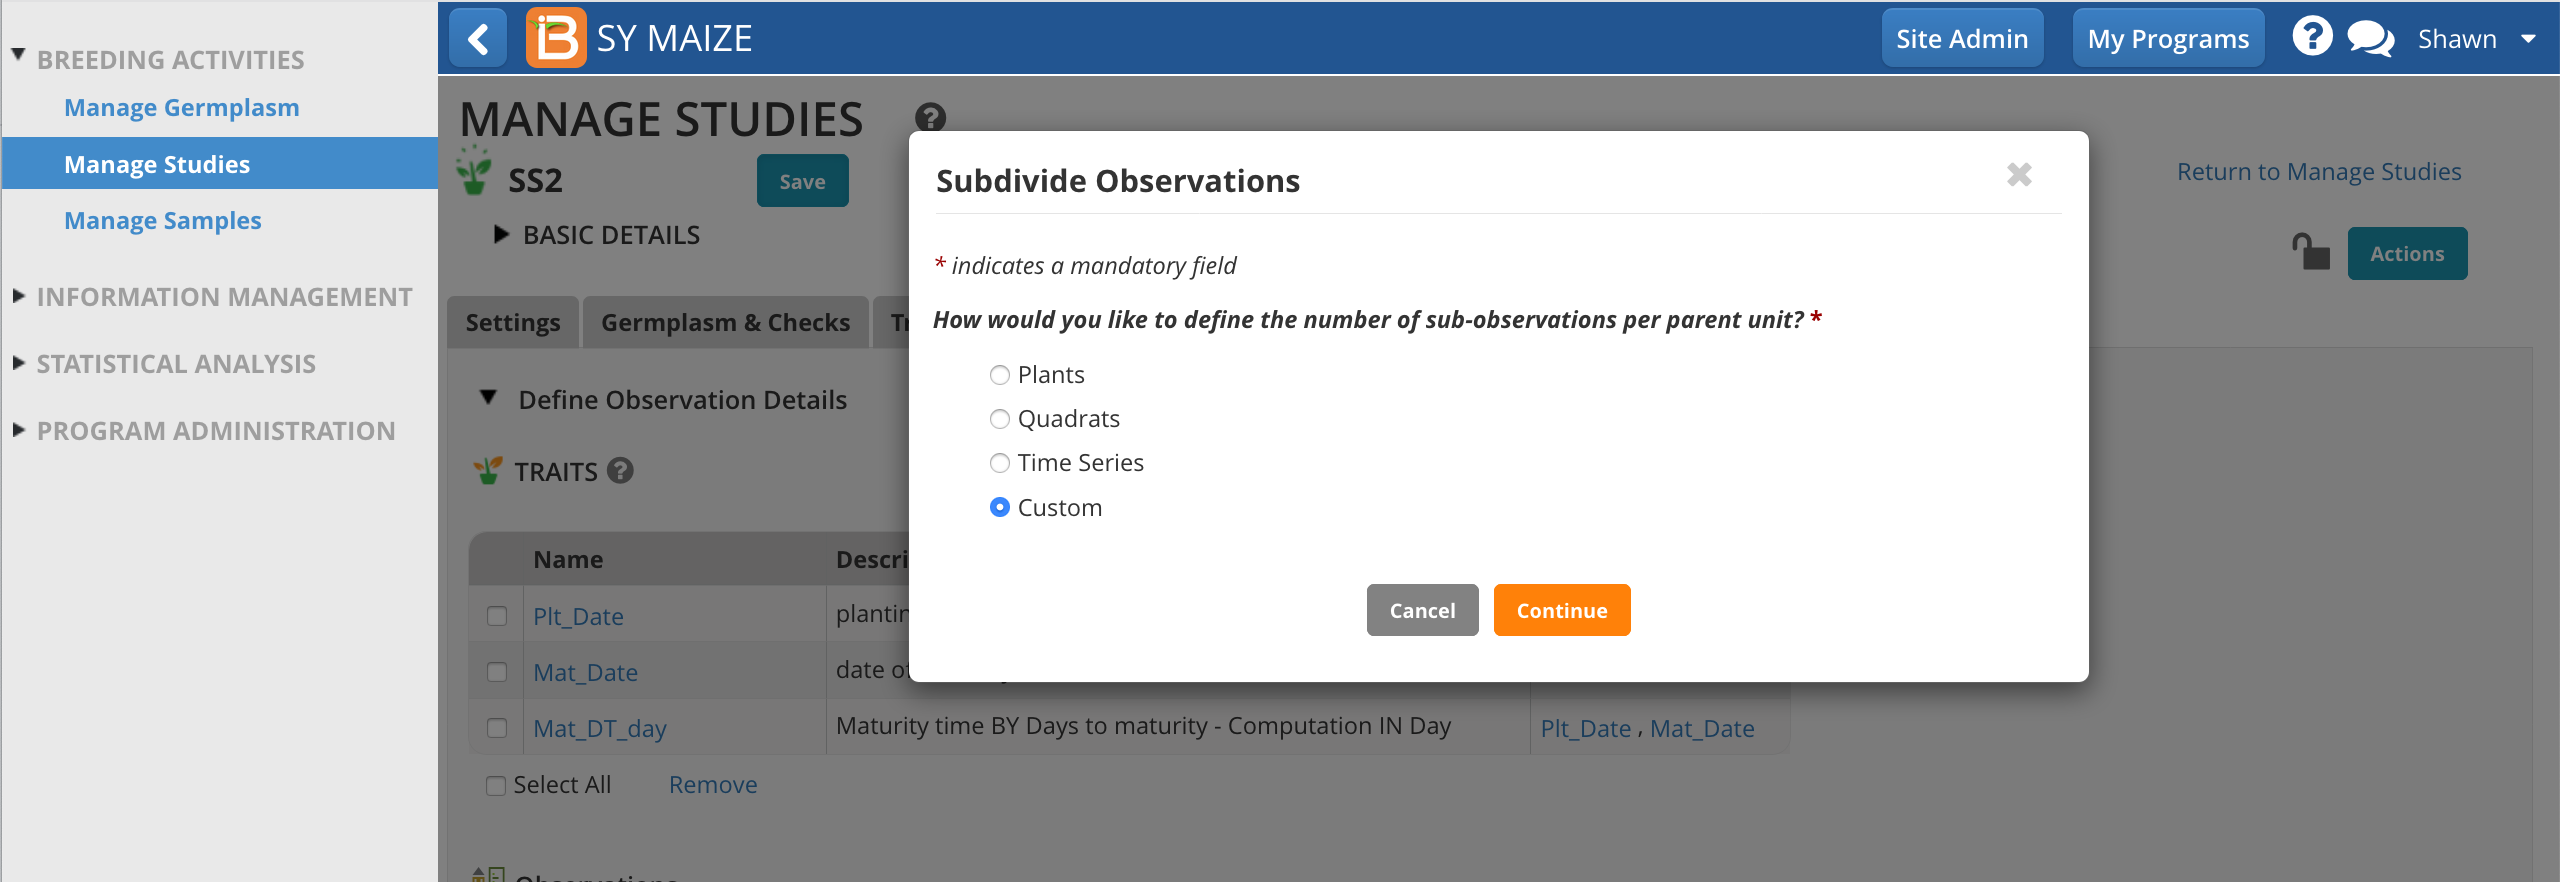
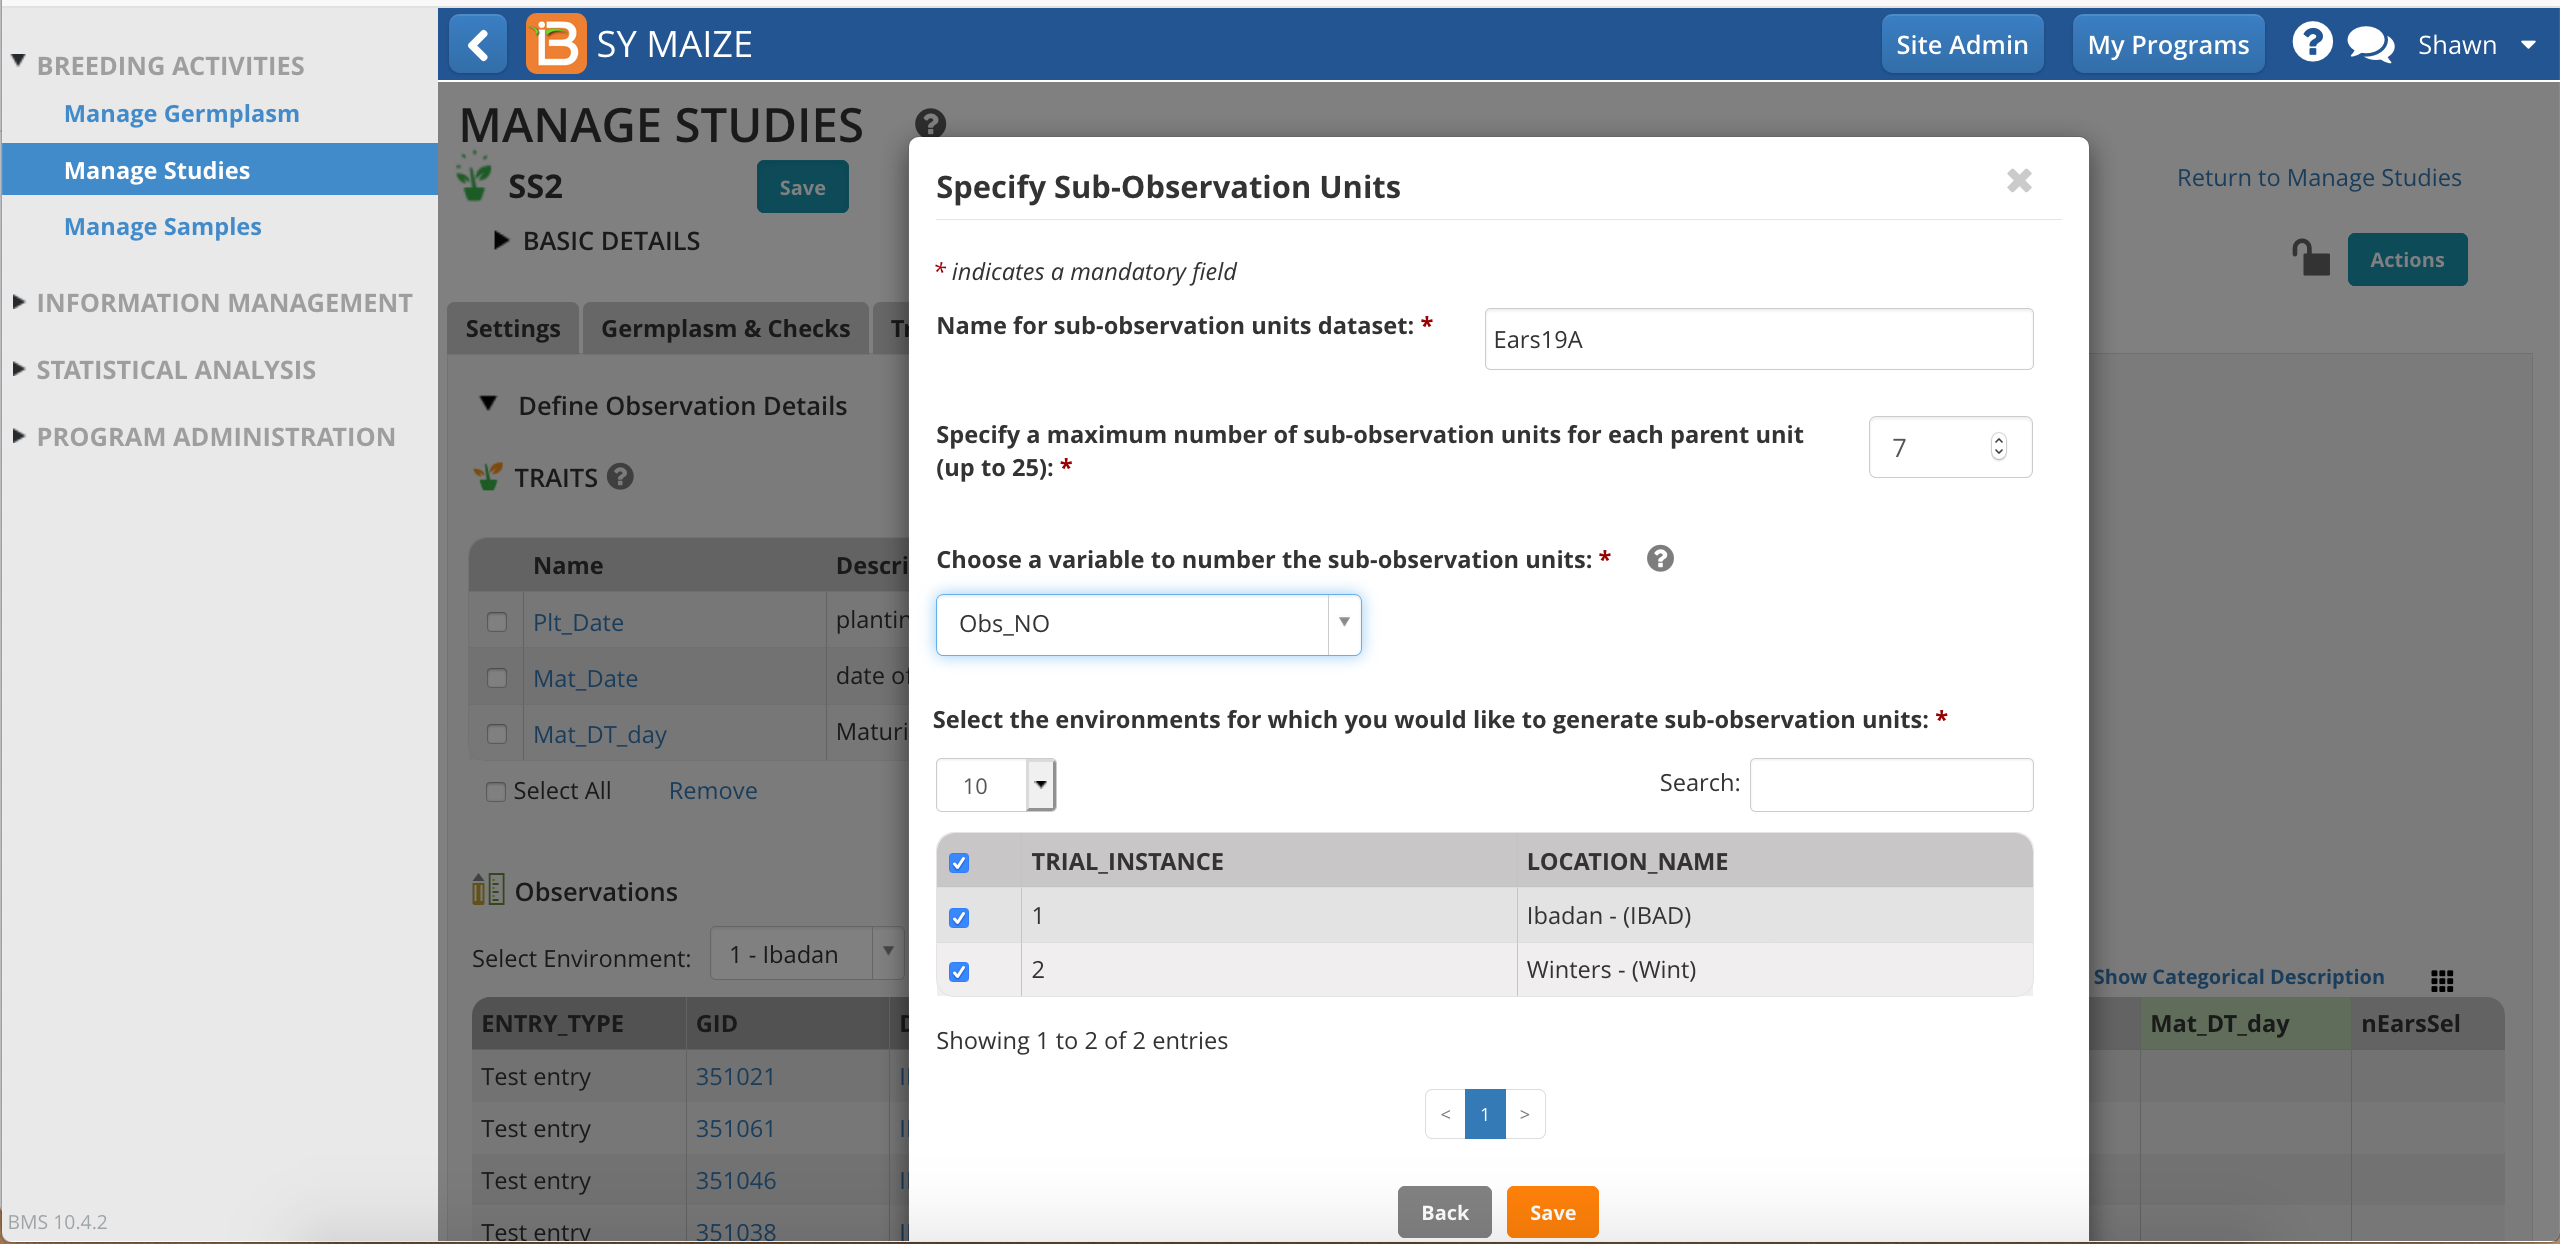
In the following example, a maize breeder is planning to gather ears of interest from experimental plots to take ear-specific measurements. The breeder doesn't know in advance how may ears will be collected, but expects to collect no more than 7 per plot.
- 'Ears' is not a default sub-sampling option. Select the Custom option and Continue.
- Give the sub-observation data set a unique name.
- Specify 7 ears as the maximum collected per plot.
- Choose a numbering variable. In this case, Obs_NO. Note: custom sub-observations units will not have a corresponding numbering variable until you create one (see details in blue info box below).
- Choose to sub-sample both study locations.
- Save.
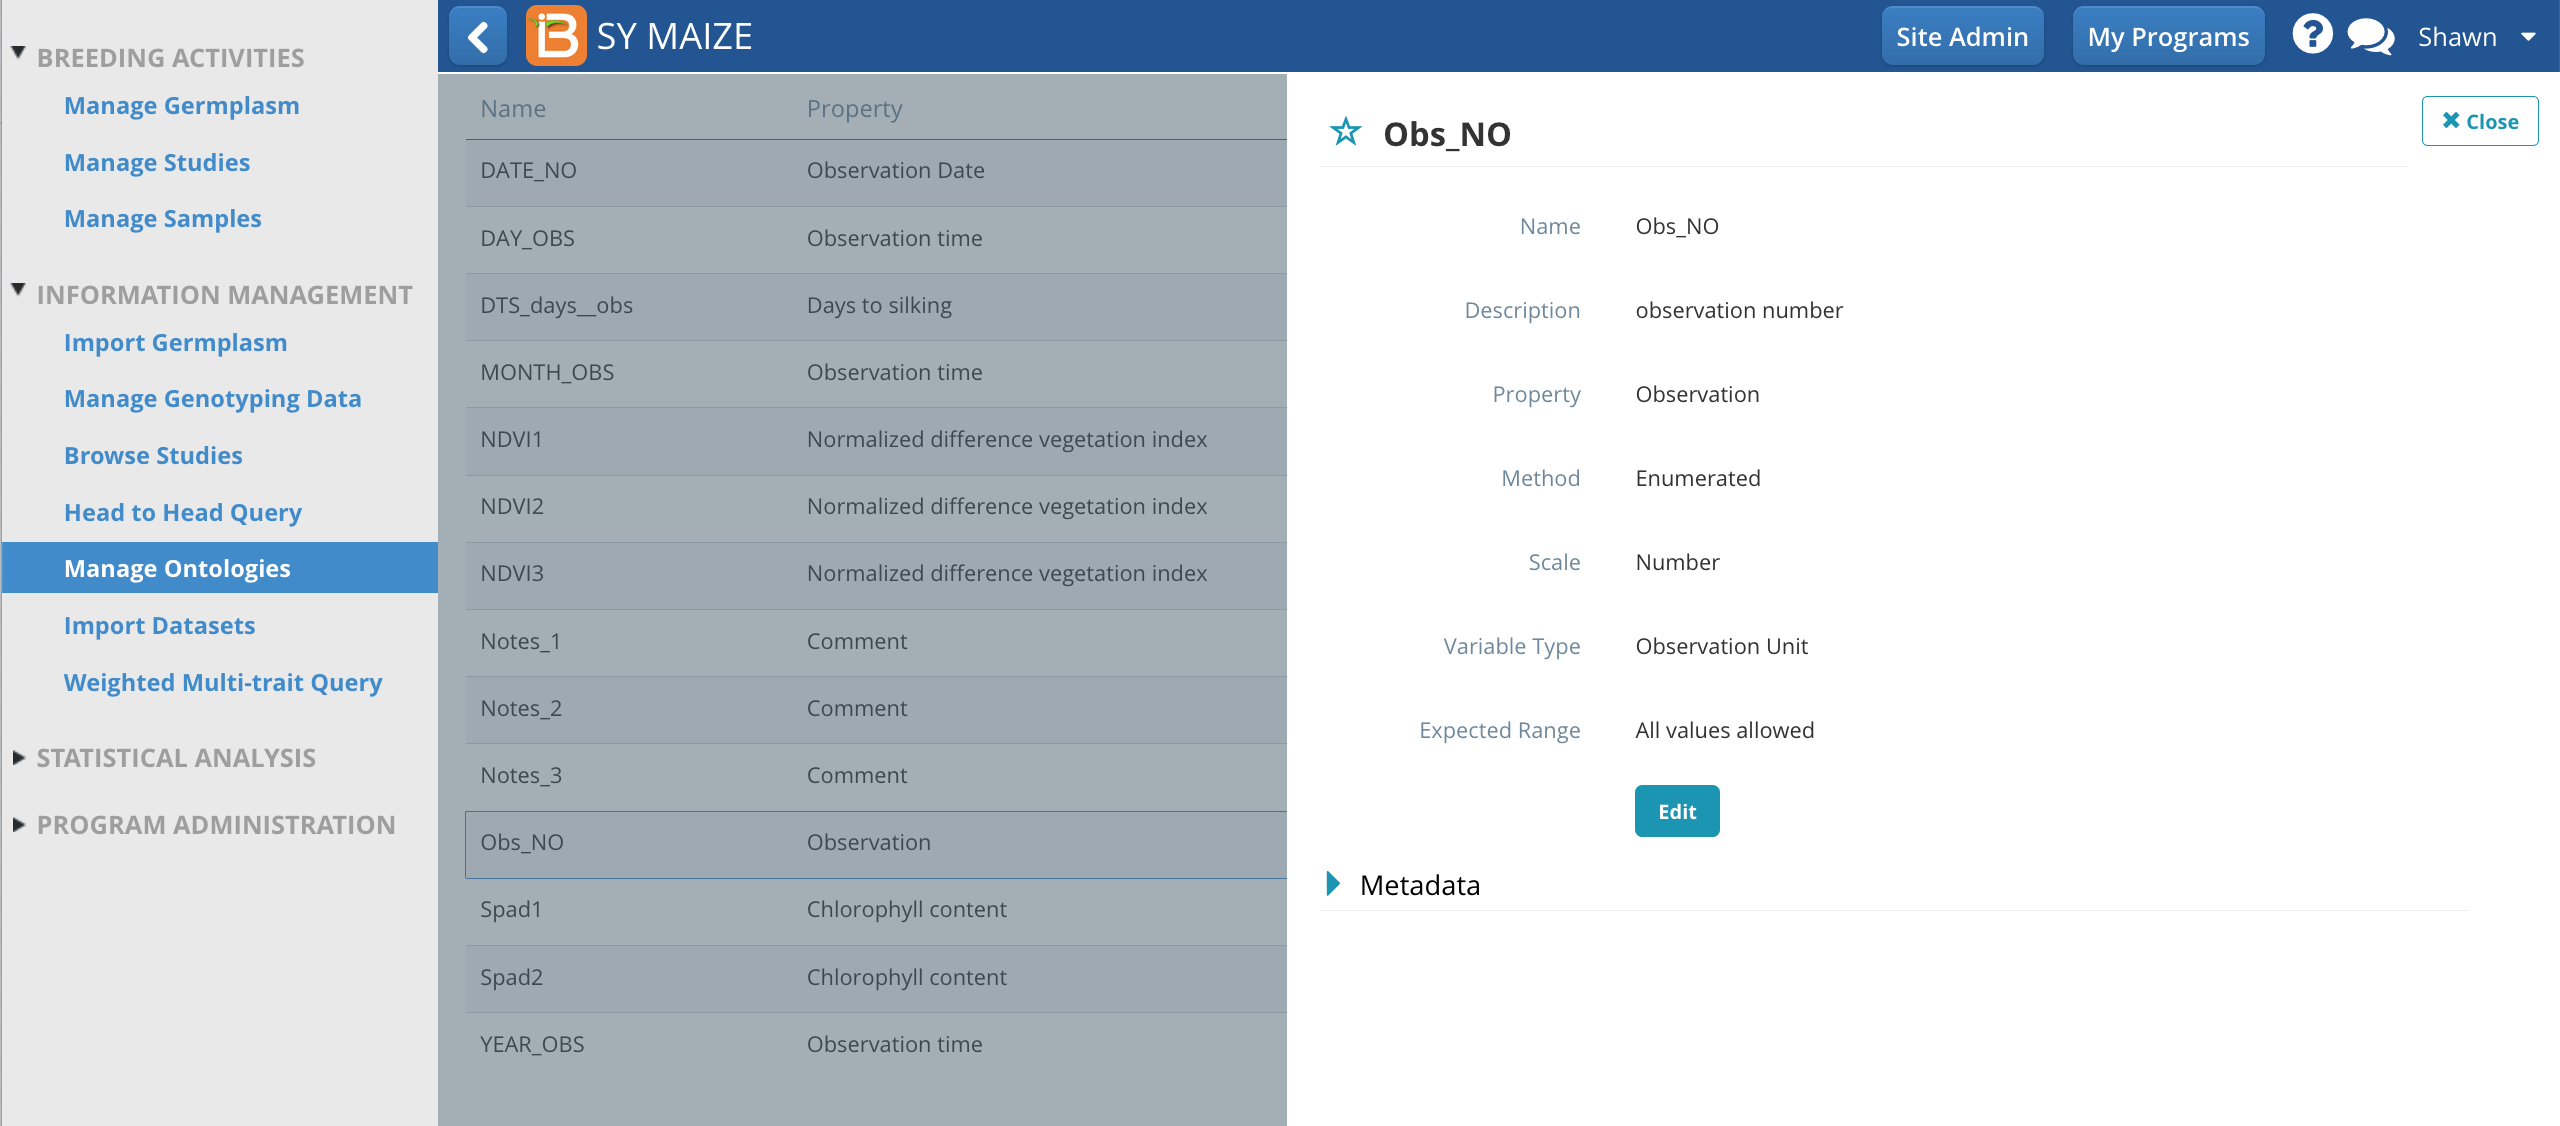
 Customize Observation Unit VariableThe observation unit variable, Obs_NO, provides a generic way to number any observation. Alternatively a more specific term, like EAR_NO, could be created via Manage Ontologies.
- The Ears sub-observation dataset is now ready to accept 7 ear measurements per plot. Add ear traits to the dataset and Save.