About
Browse studies provides a consolidated view of completed studies, including environmental means data. Browse studies also offers a graphical filtering tool to assist selections.
Browse
- Browse directory to select studies from the file directory. The browse studies file directory is the only directory where study names can be edited by selecting the pen icon.
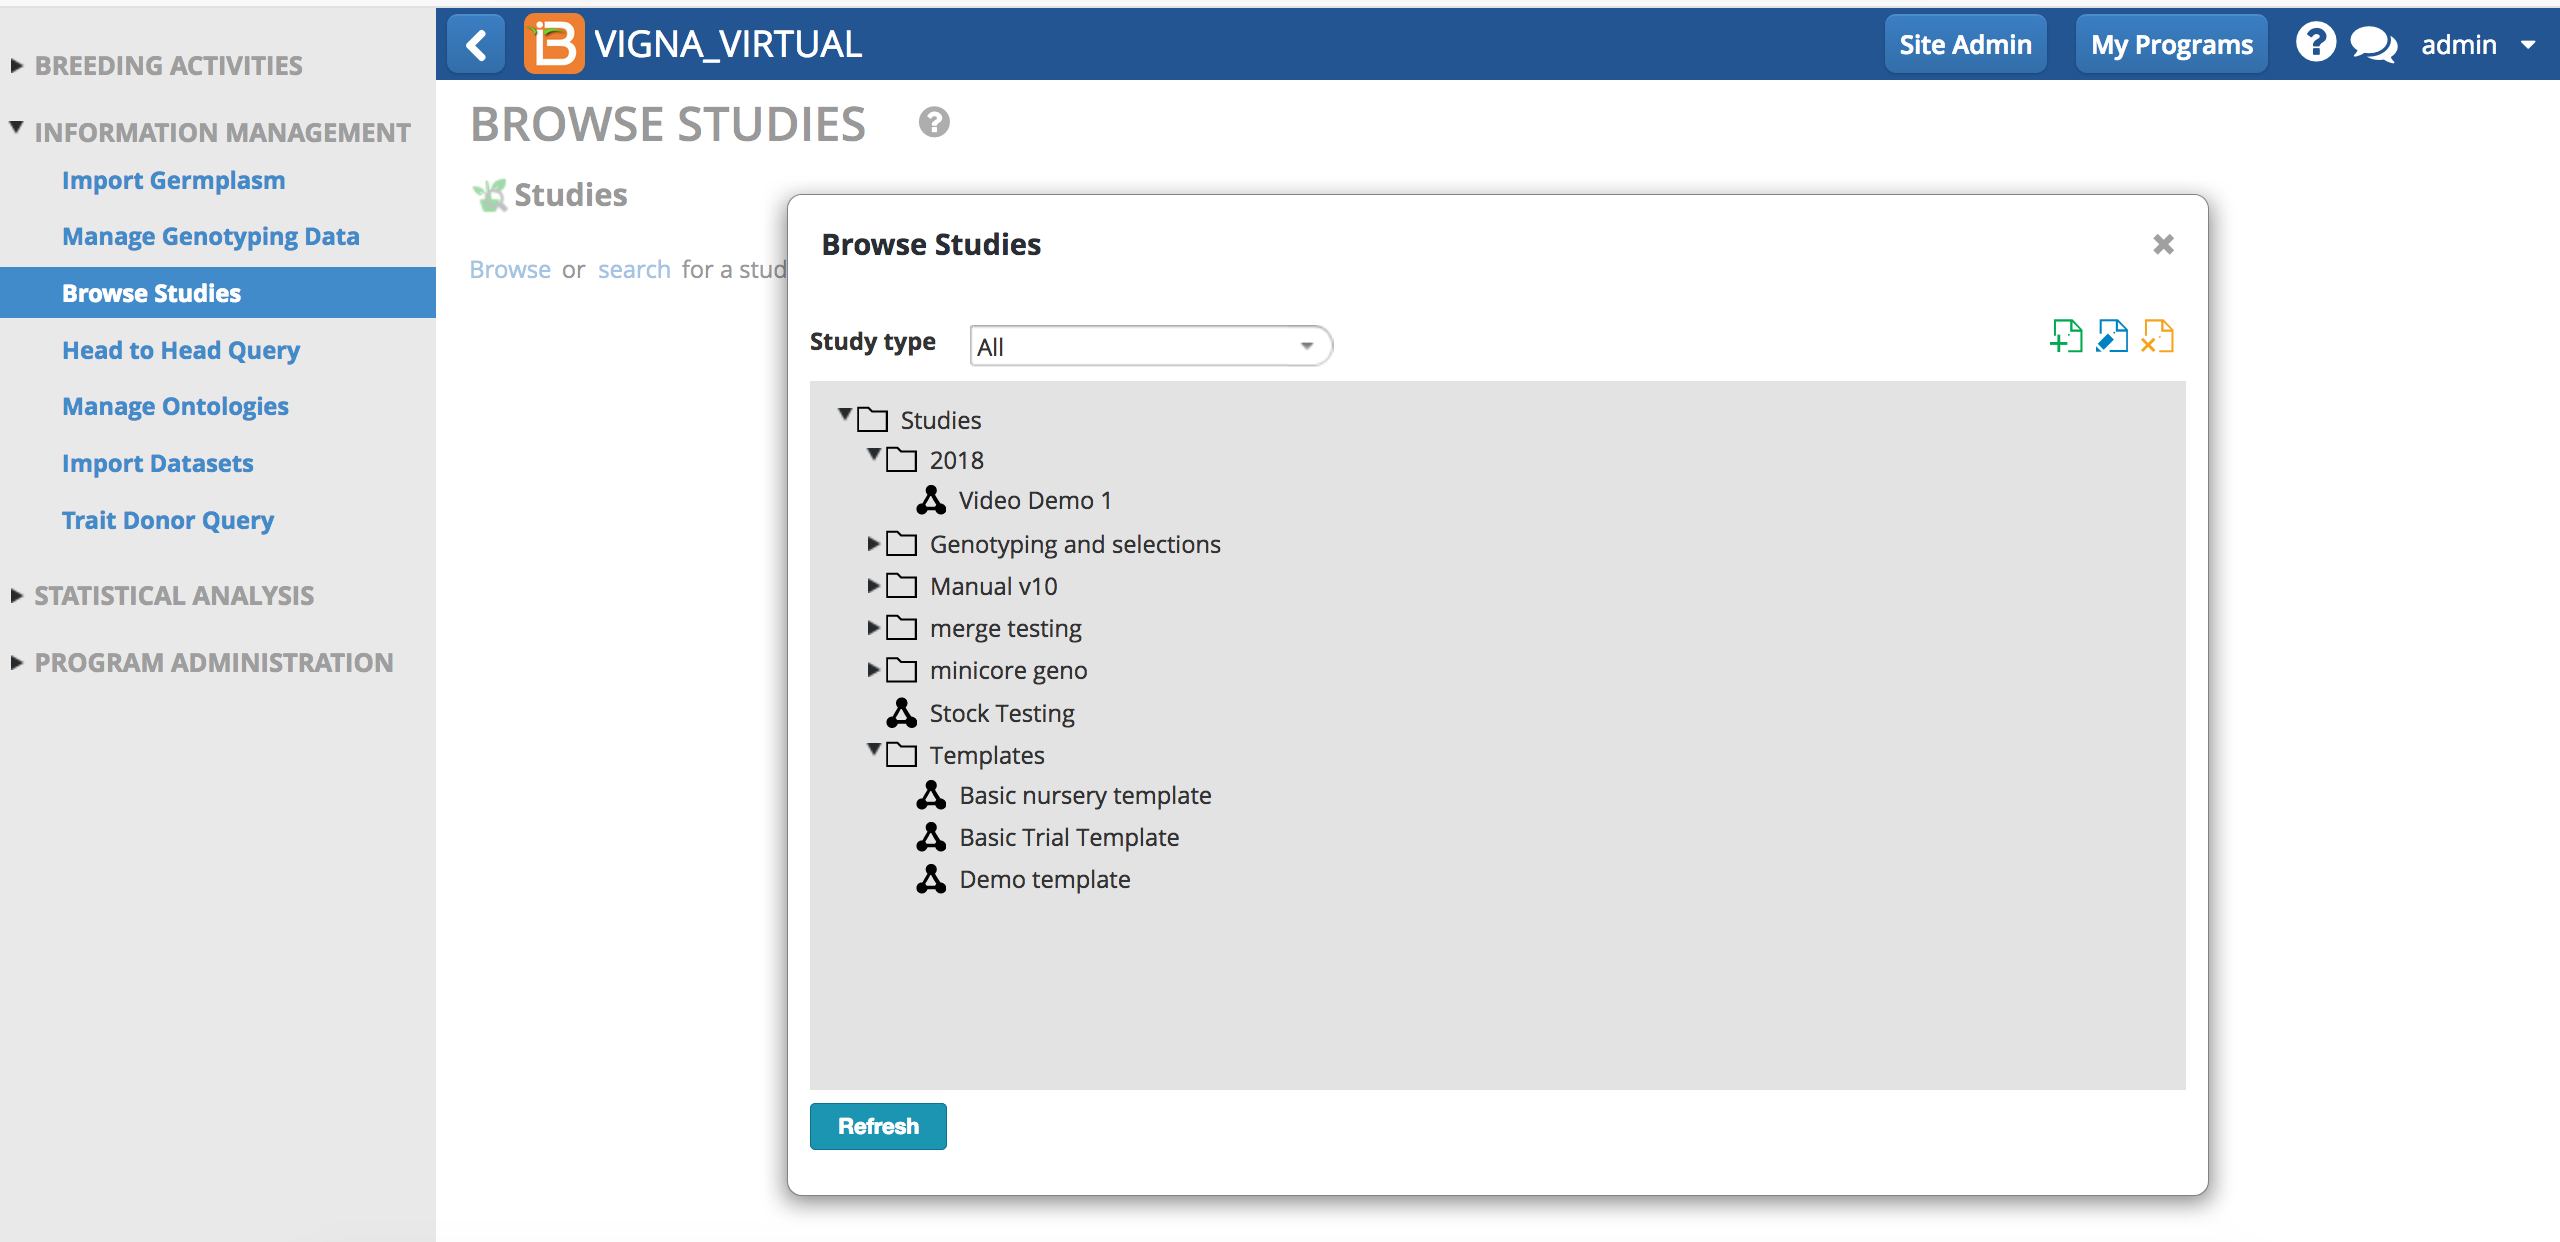
- Filter studies by study type.

- Select study from the file directory. Selected studies will open behind the pop-up directory. Close the pop-up directory to view.
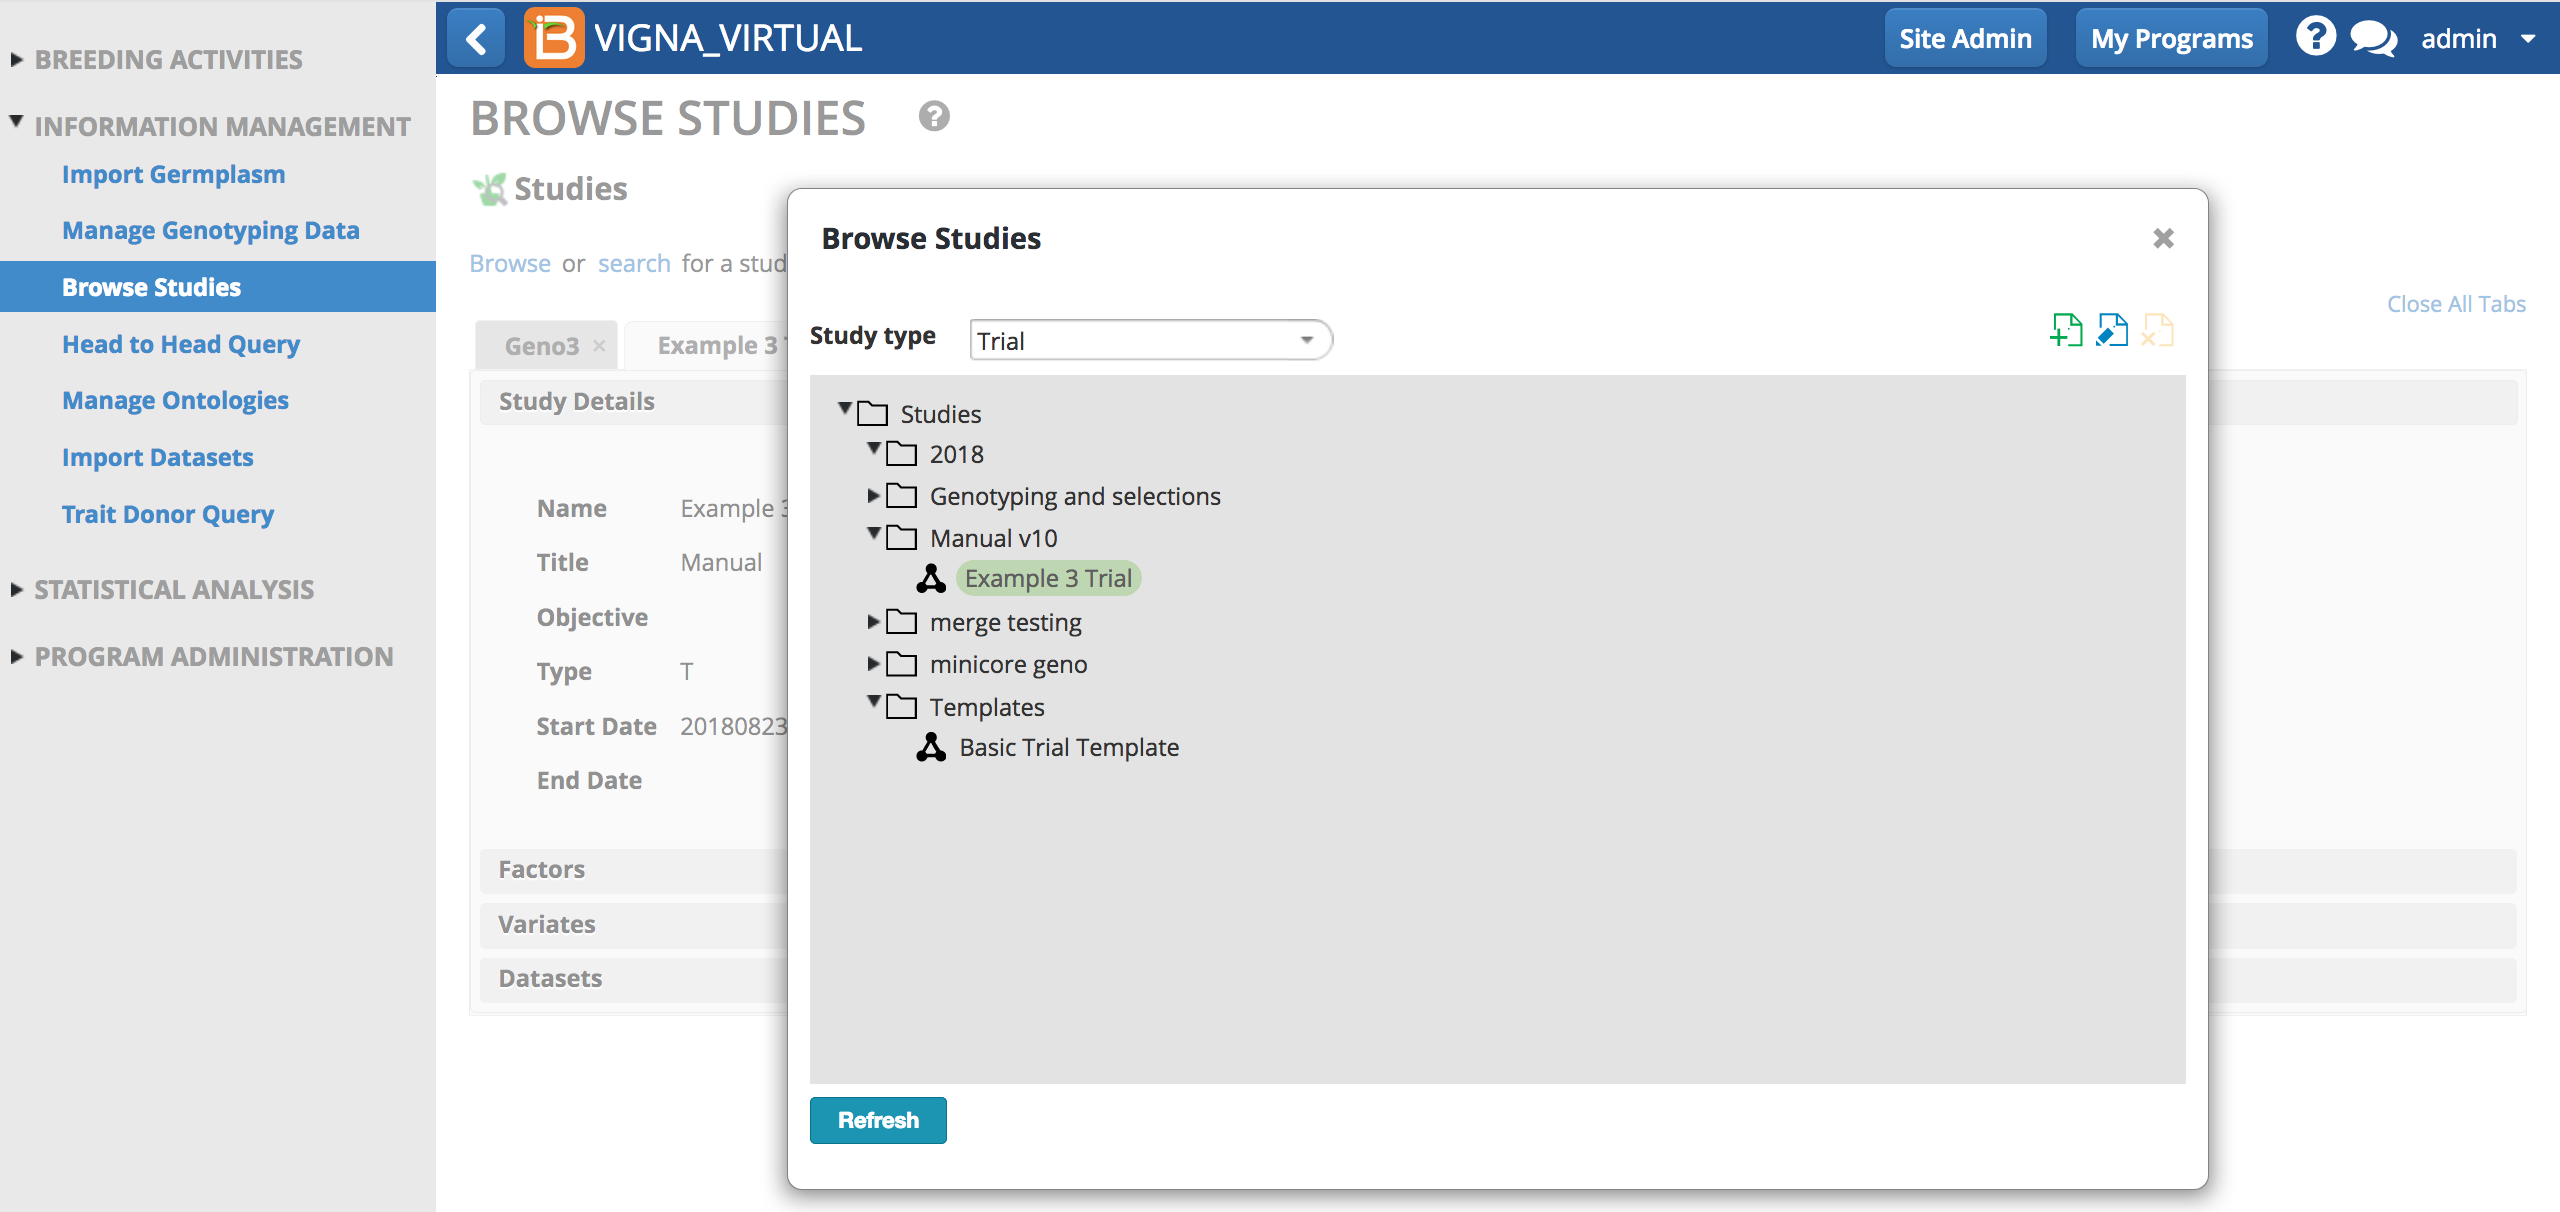
- Close file directory popup window to review study details.
Search
- Use the Search tab to find studies based on date, name, country, and season. Highlight the appropriate search result to open the details behind the popup.
Review
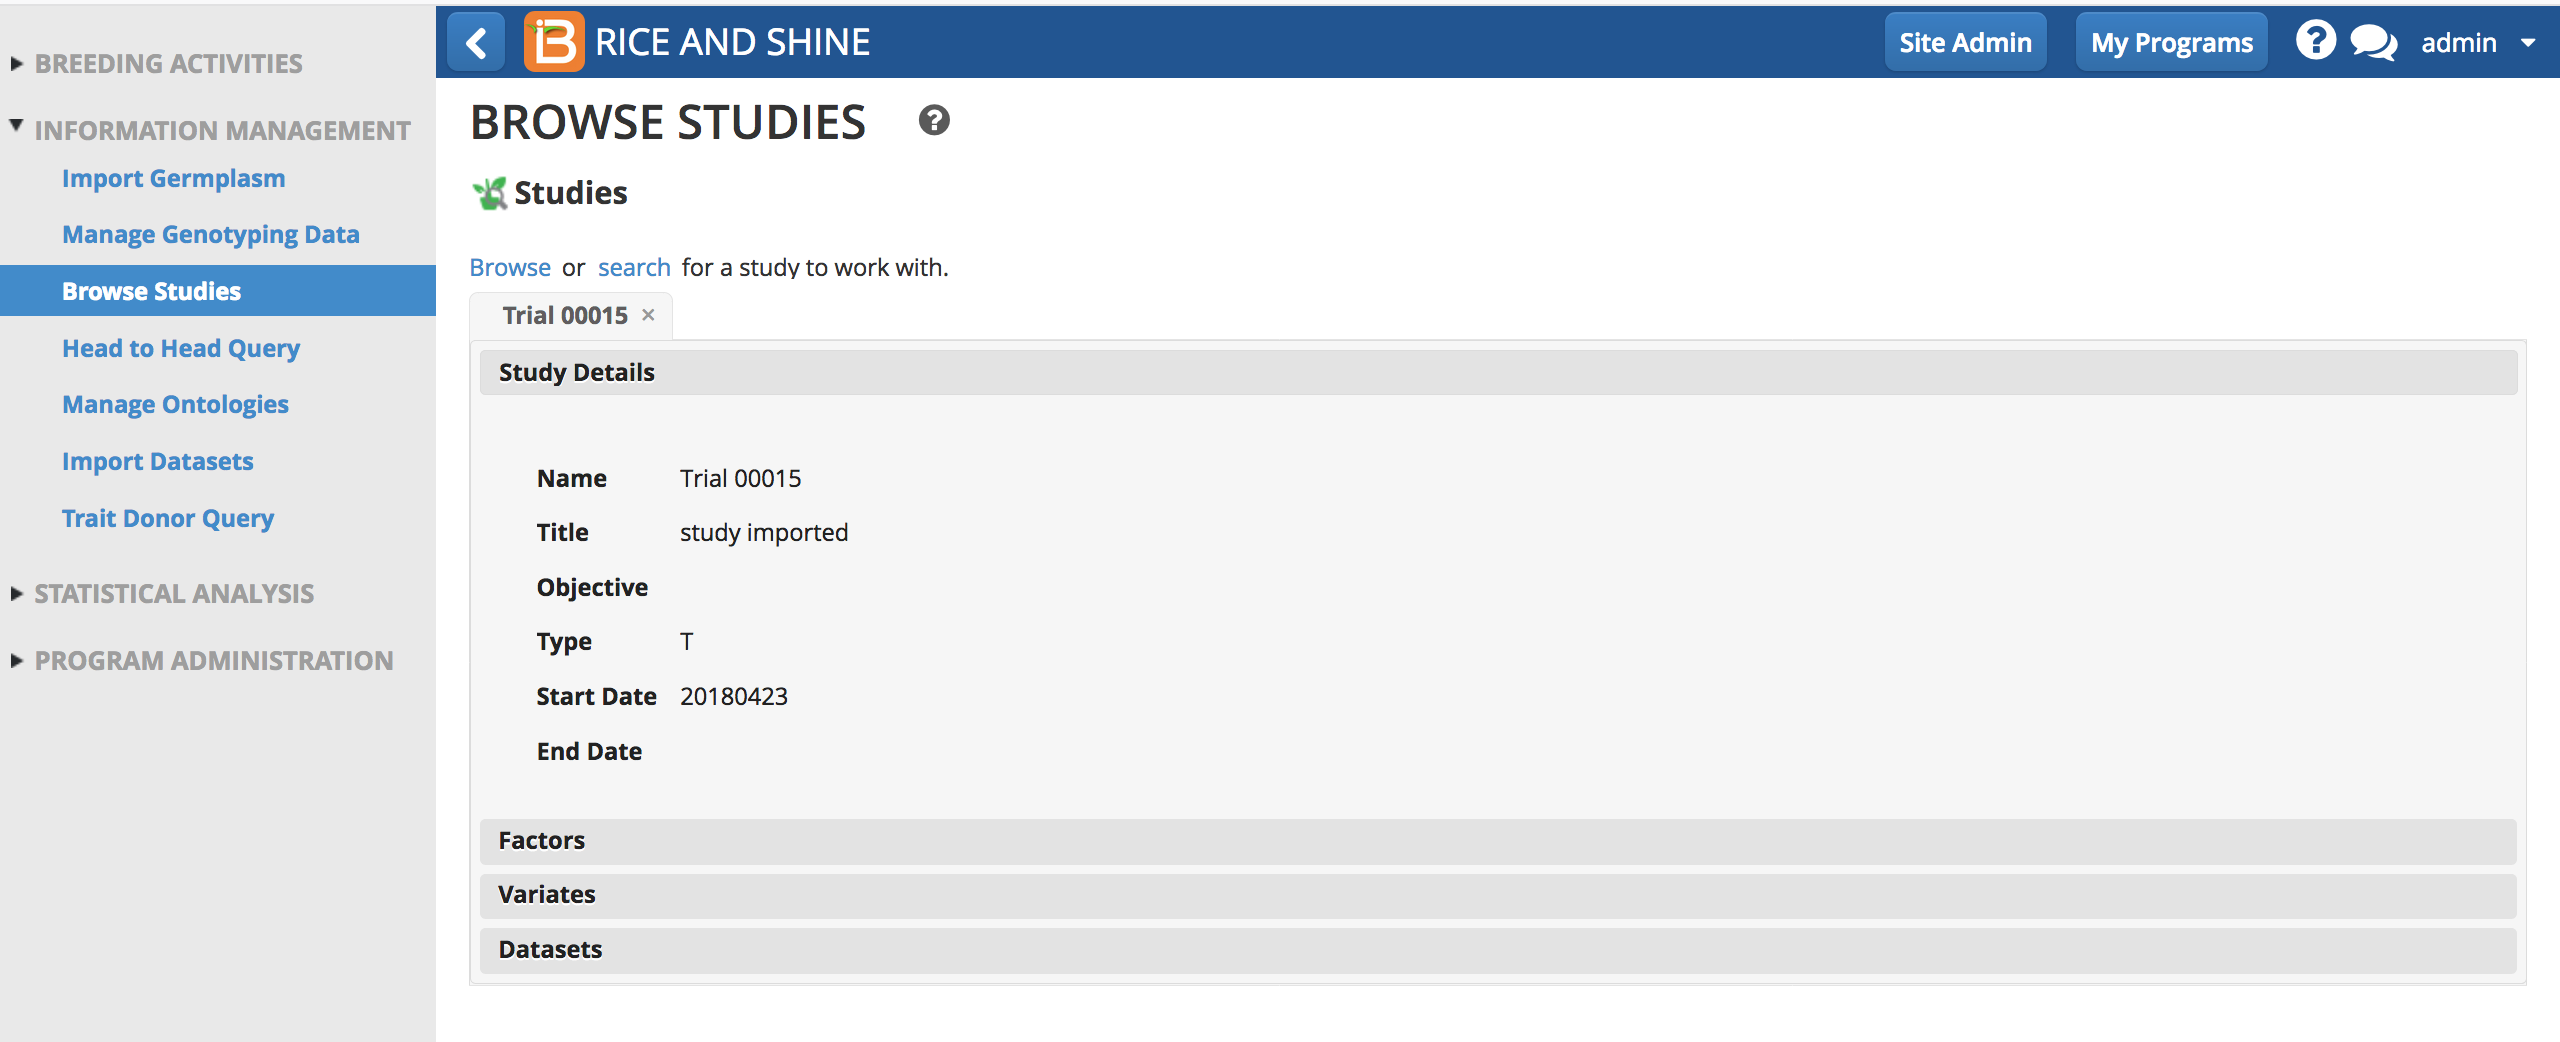
- Select Study Details to review.
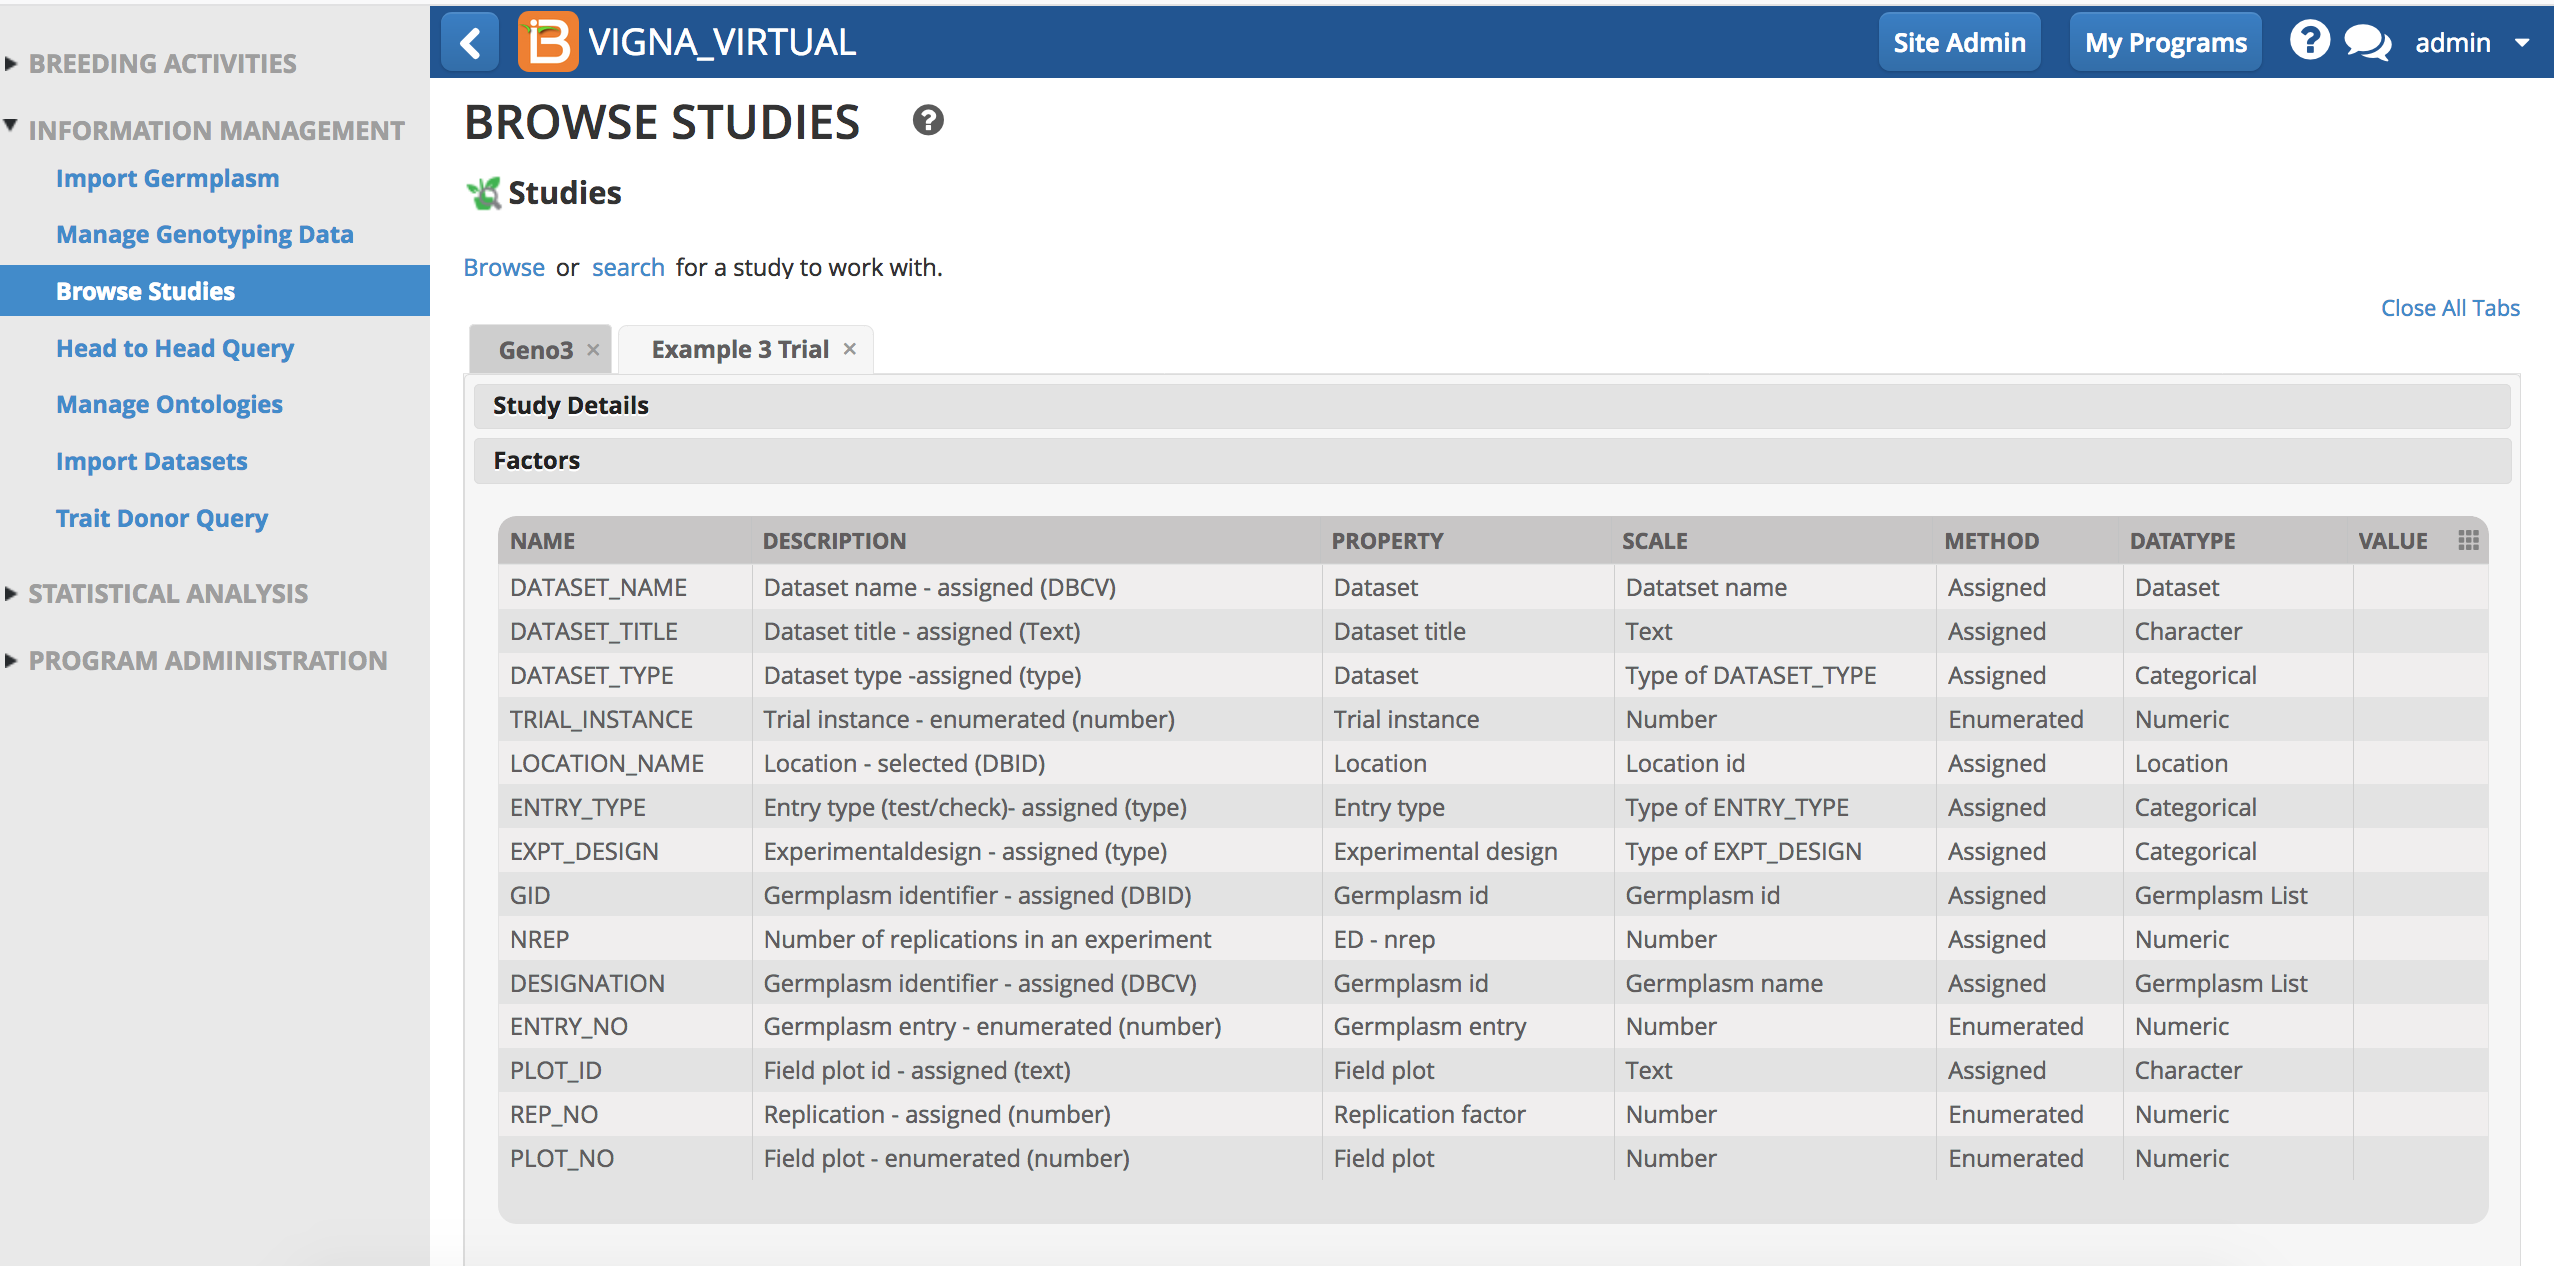
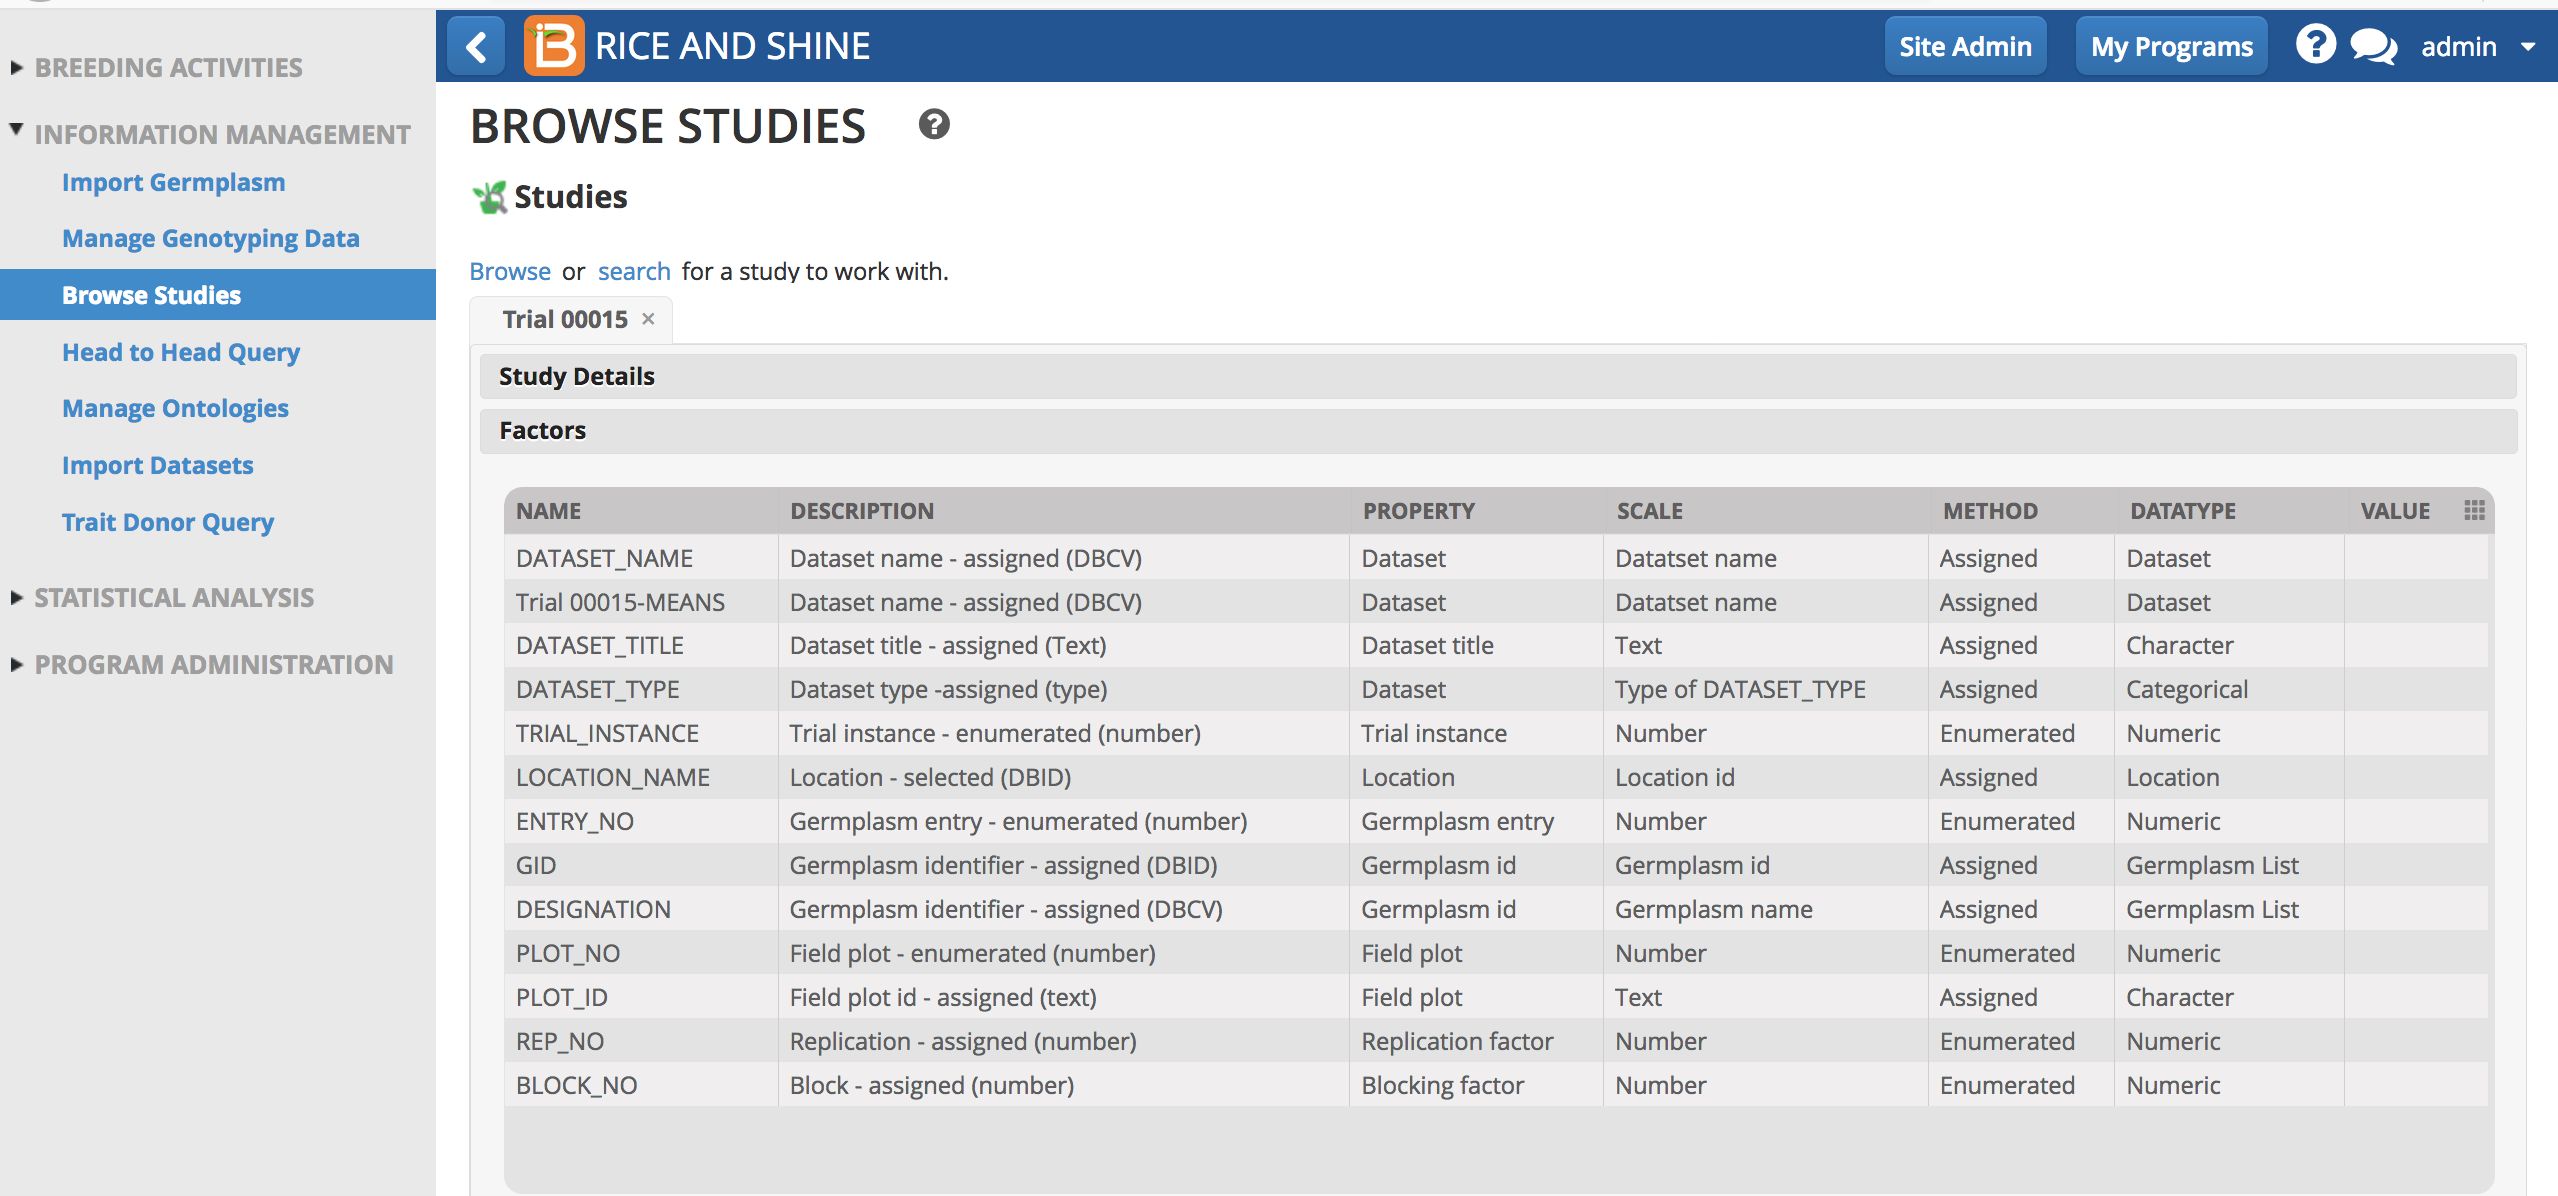
- Select Factors to review.
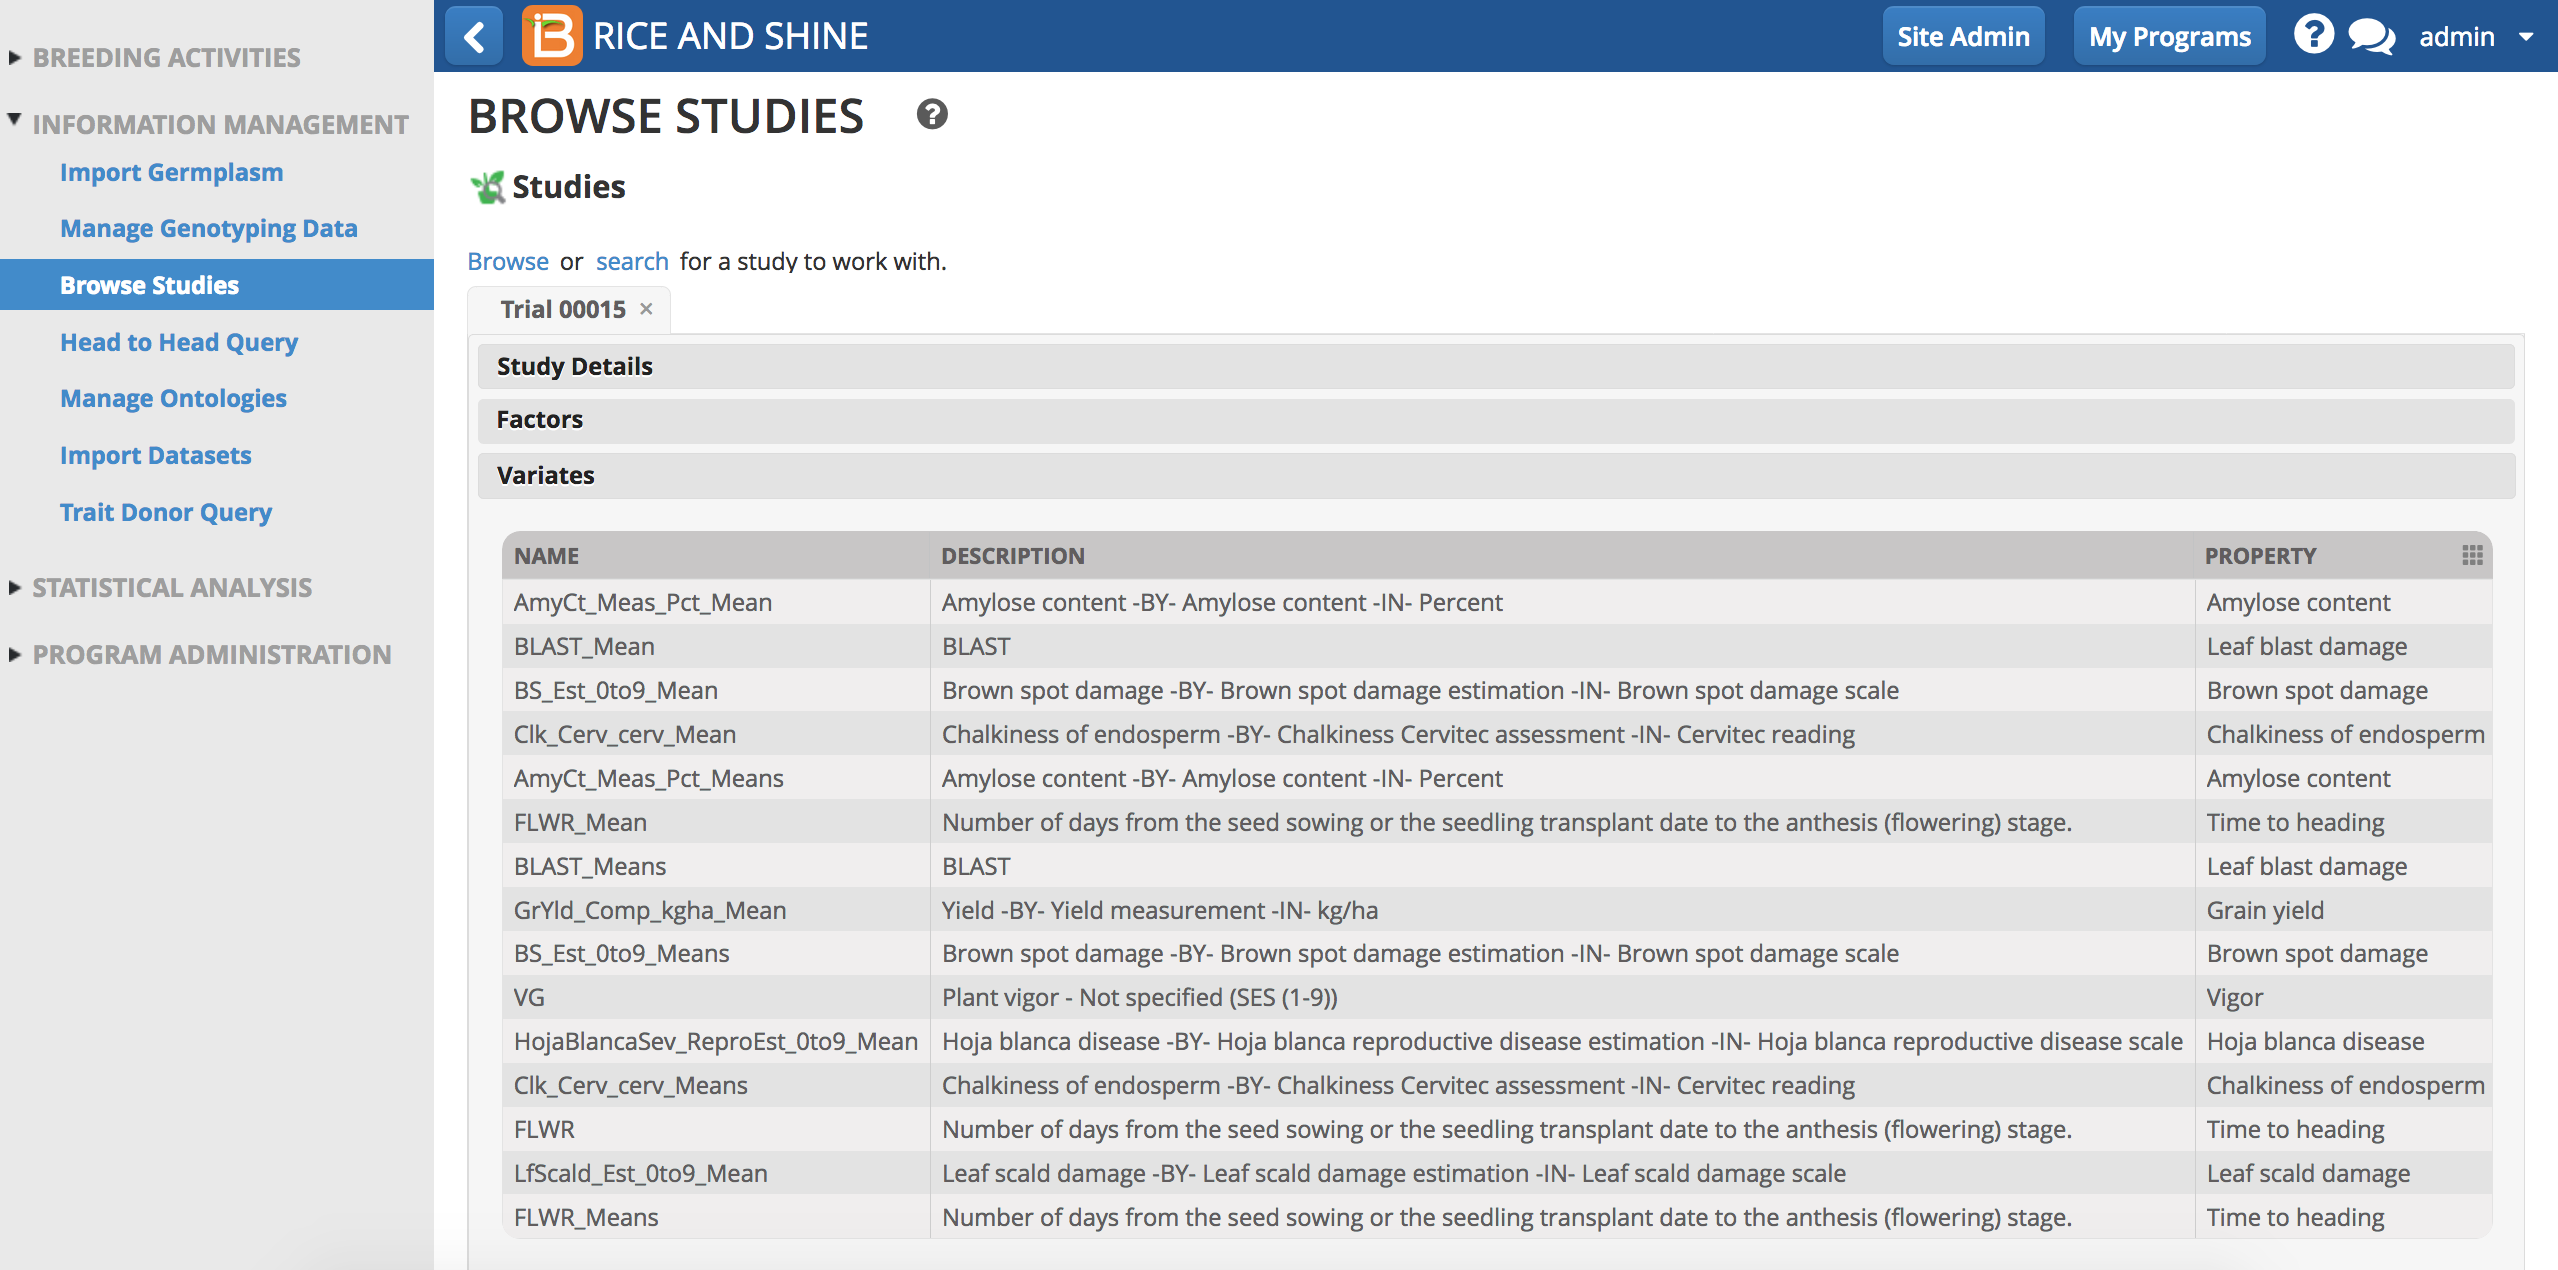
- Select Variates to review.
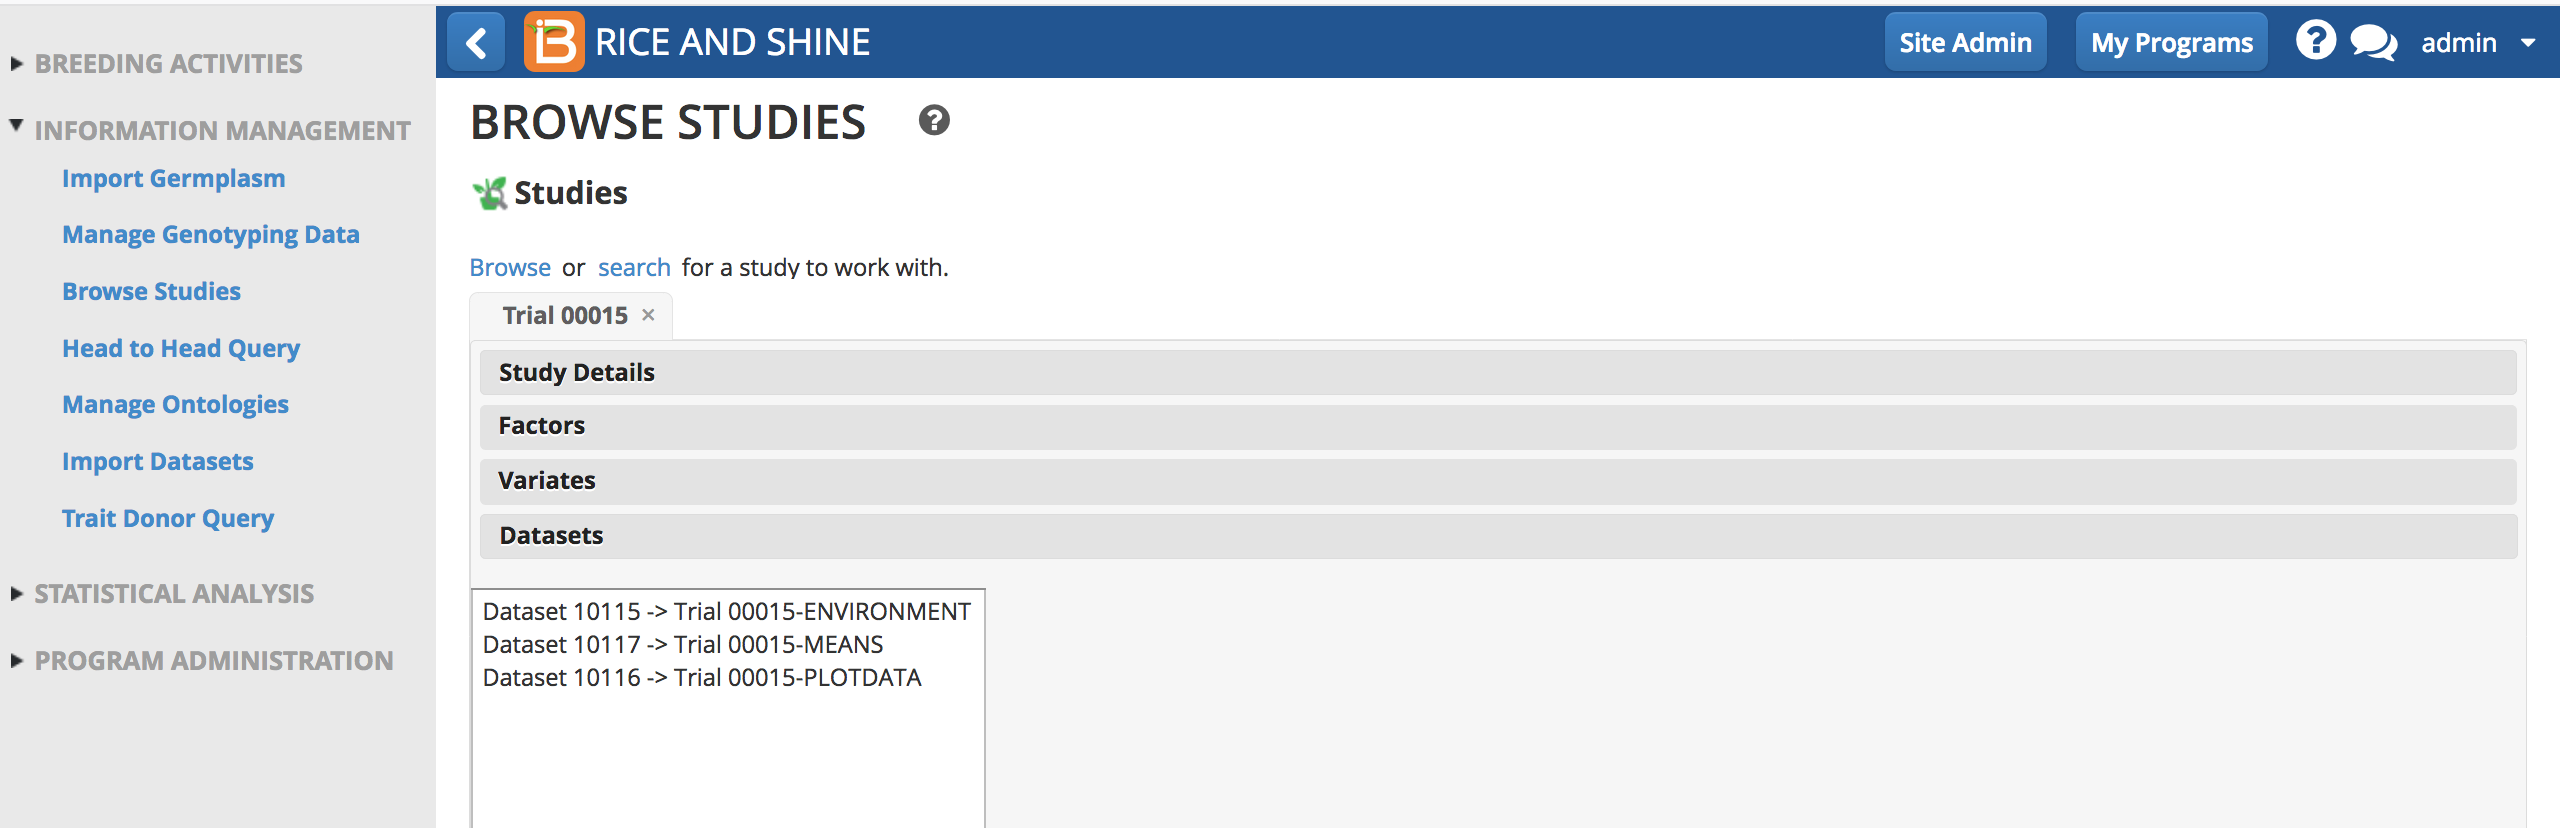
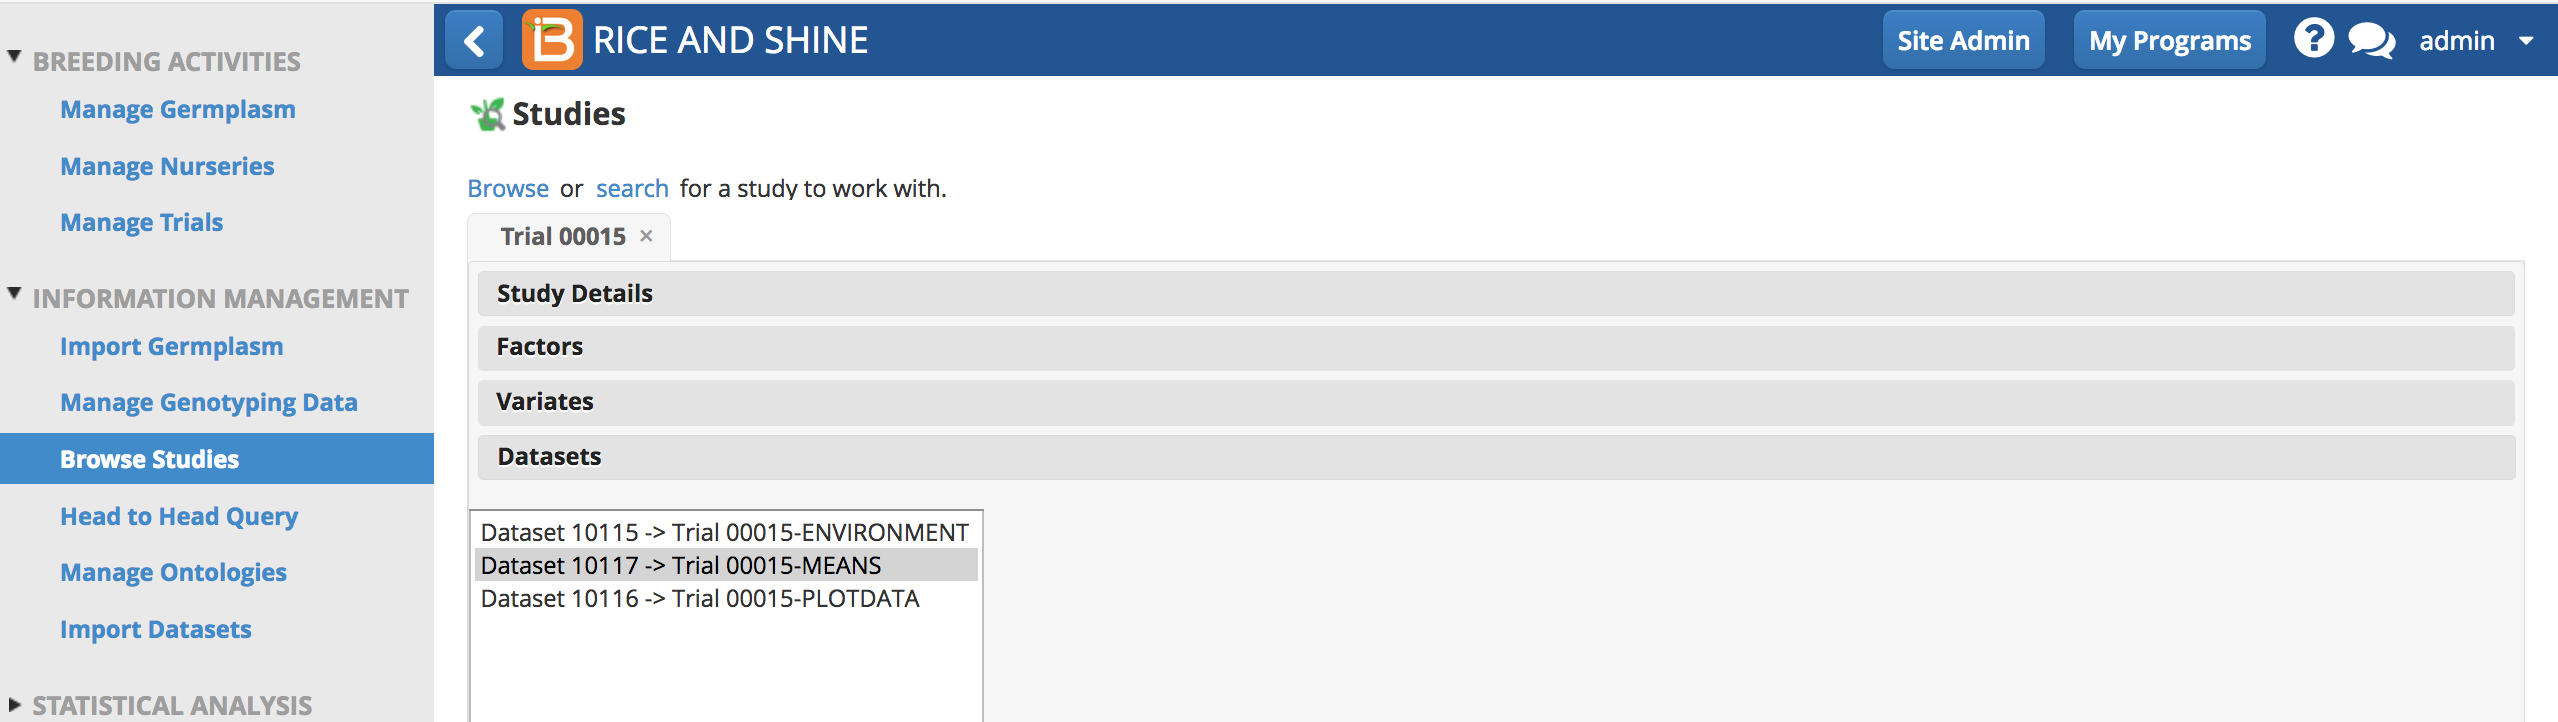
- Select Datasets to review.
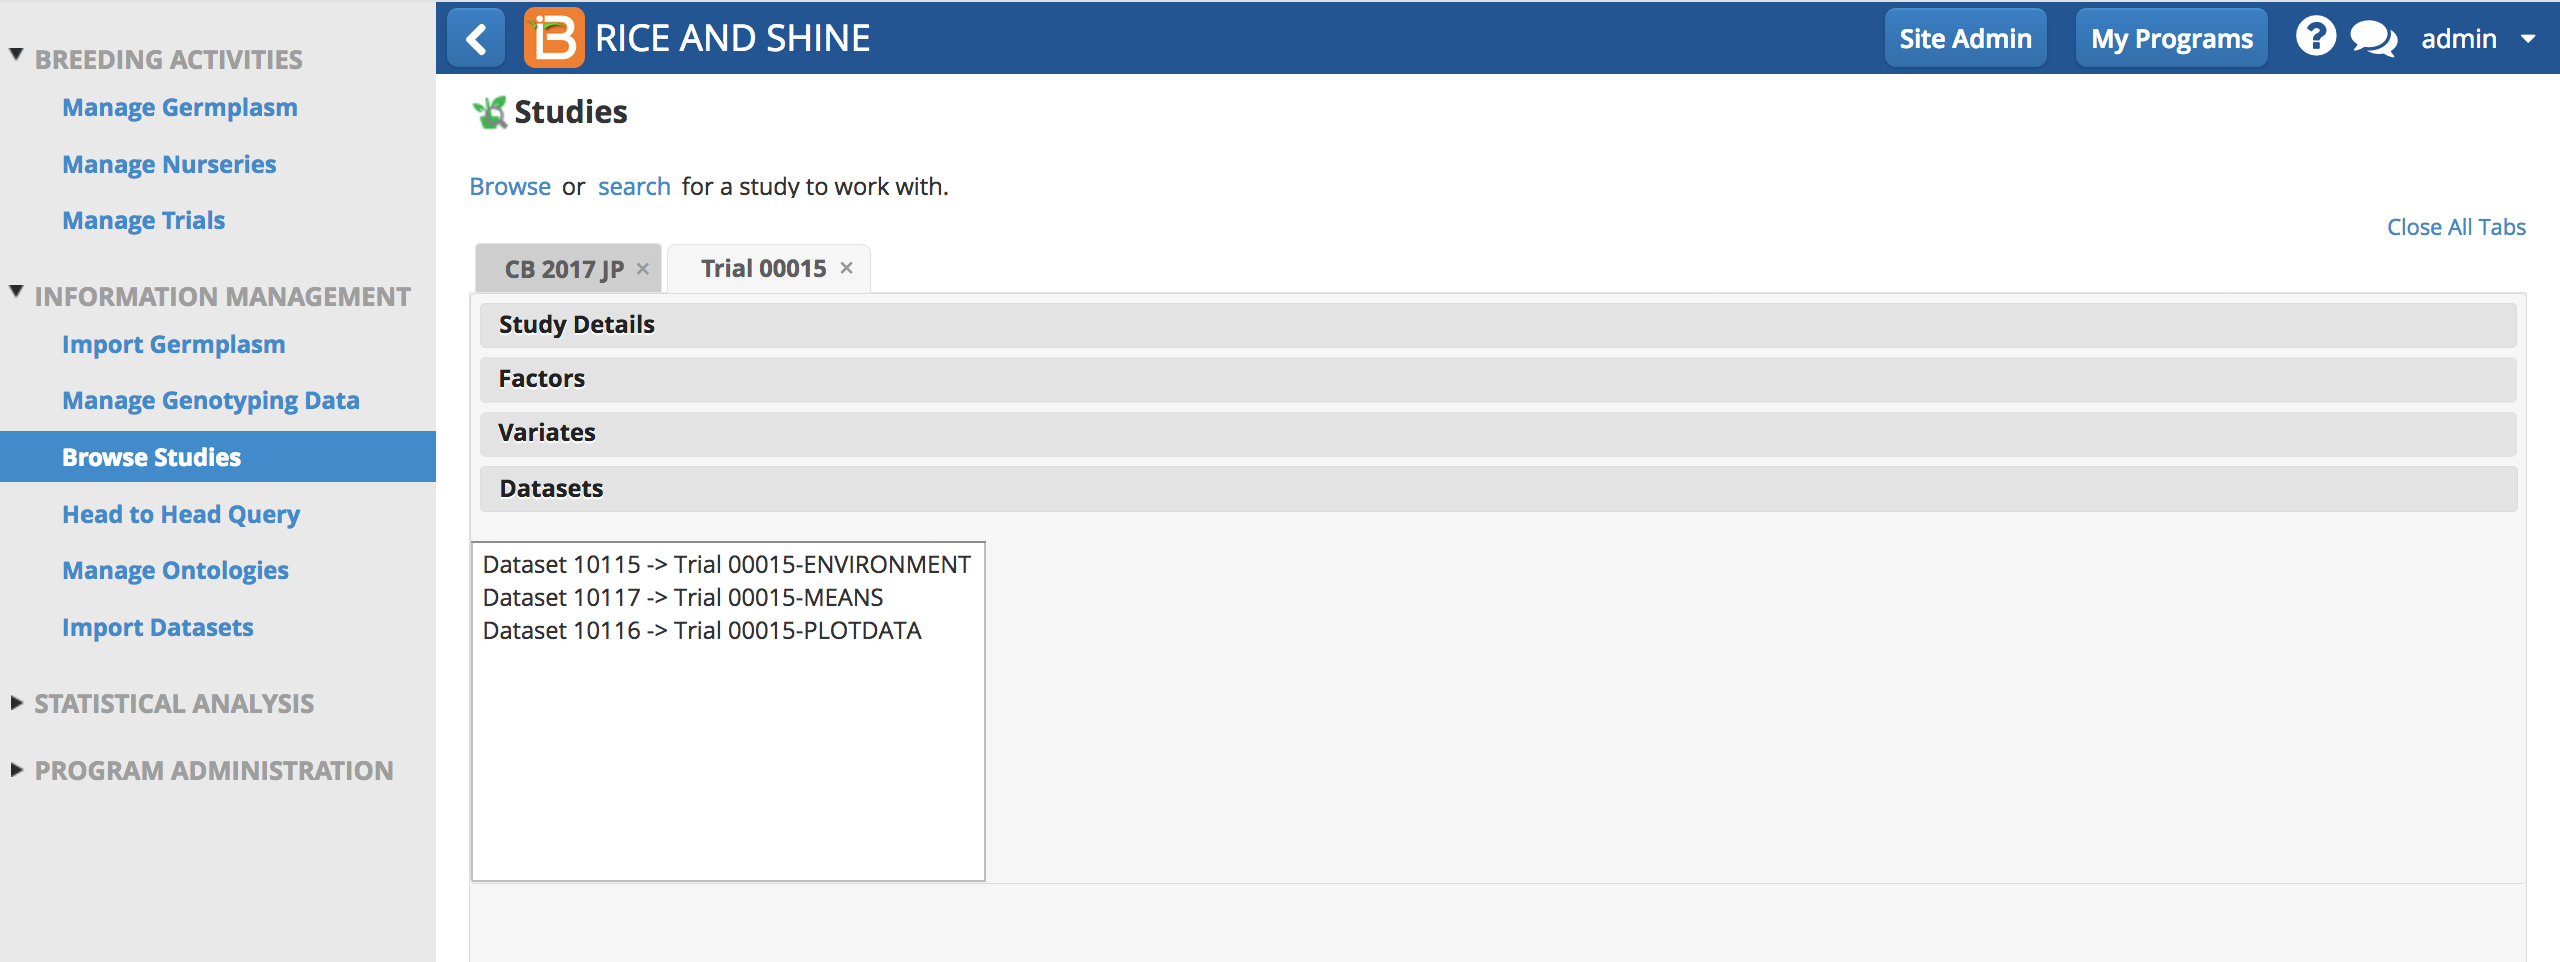
Environment Dataset
The environment dataset provides the means of replicates within each environment (trial instance) for all traits measured. These are summary statistics that can be uploaded from the Breeding View Single Site Analysis.
- Select environment dataset.
The environment data set offers several options for review and decision making.
- Export selected environmental datasets as .xls file.
- Open in an expanded table view.
- Open in Graphical Filtering Tool.
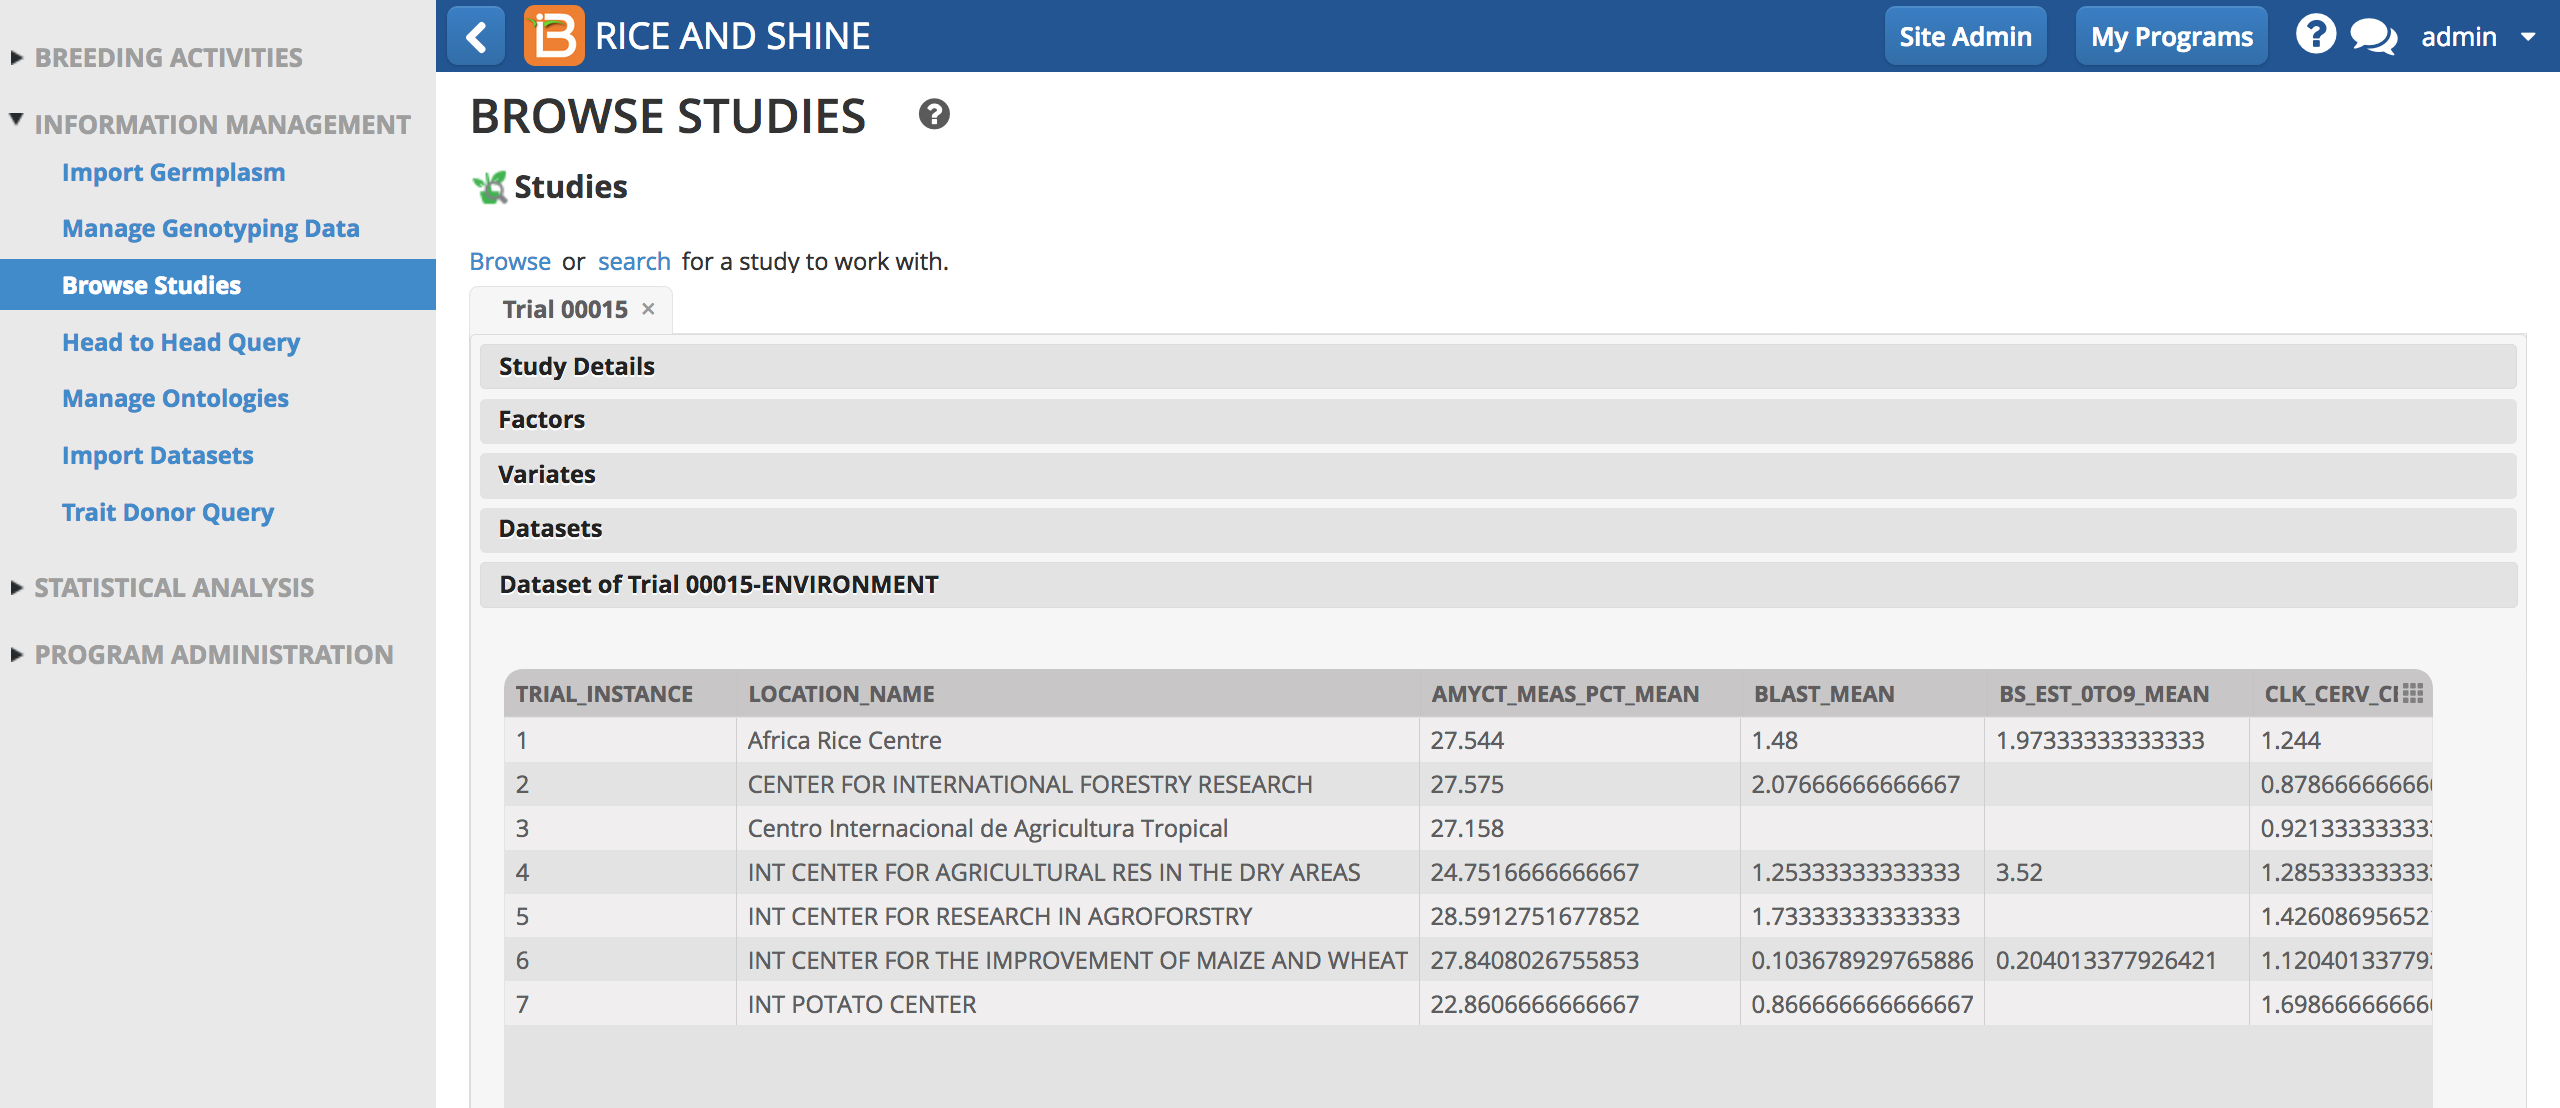
Observations were preformed at 7 locations in this study.
Graphical Filtering - BETA
Graphical filtering can be used assist selection decisions. This feature is currently available from within a single environment. Expect expanded functionality in future releases. The graphical filtering tool was designed by the CassavaBase group at Cornell University, and is an example of a BMS "plug-and-play" application using open source API calls defined by BrAPI.
- Select environment of interest and Open Graphical Filtering Tool.

The default tabular view (not grouped by accession) displays all of the recorded measurements from the selected environment.
- Select Group by Accession and Load to reveal the mean value for each germplasm entry in this environment.
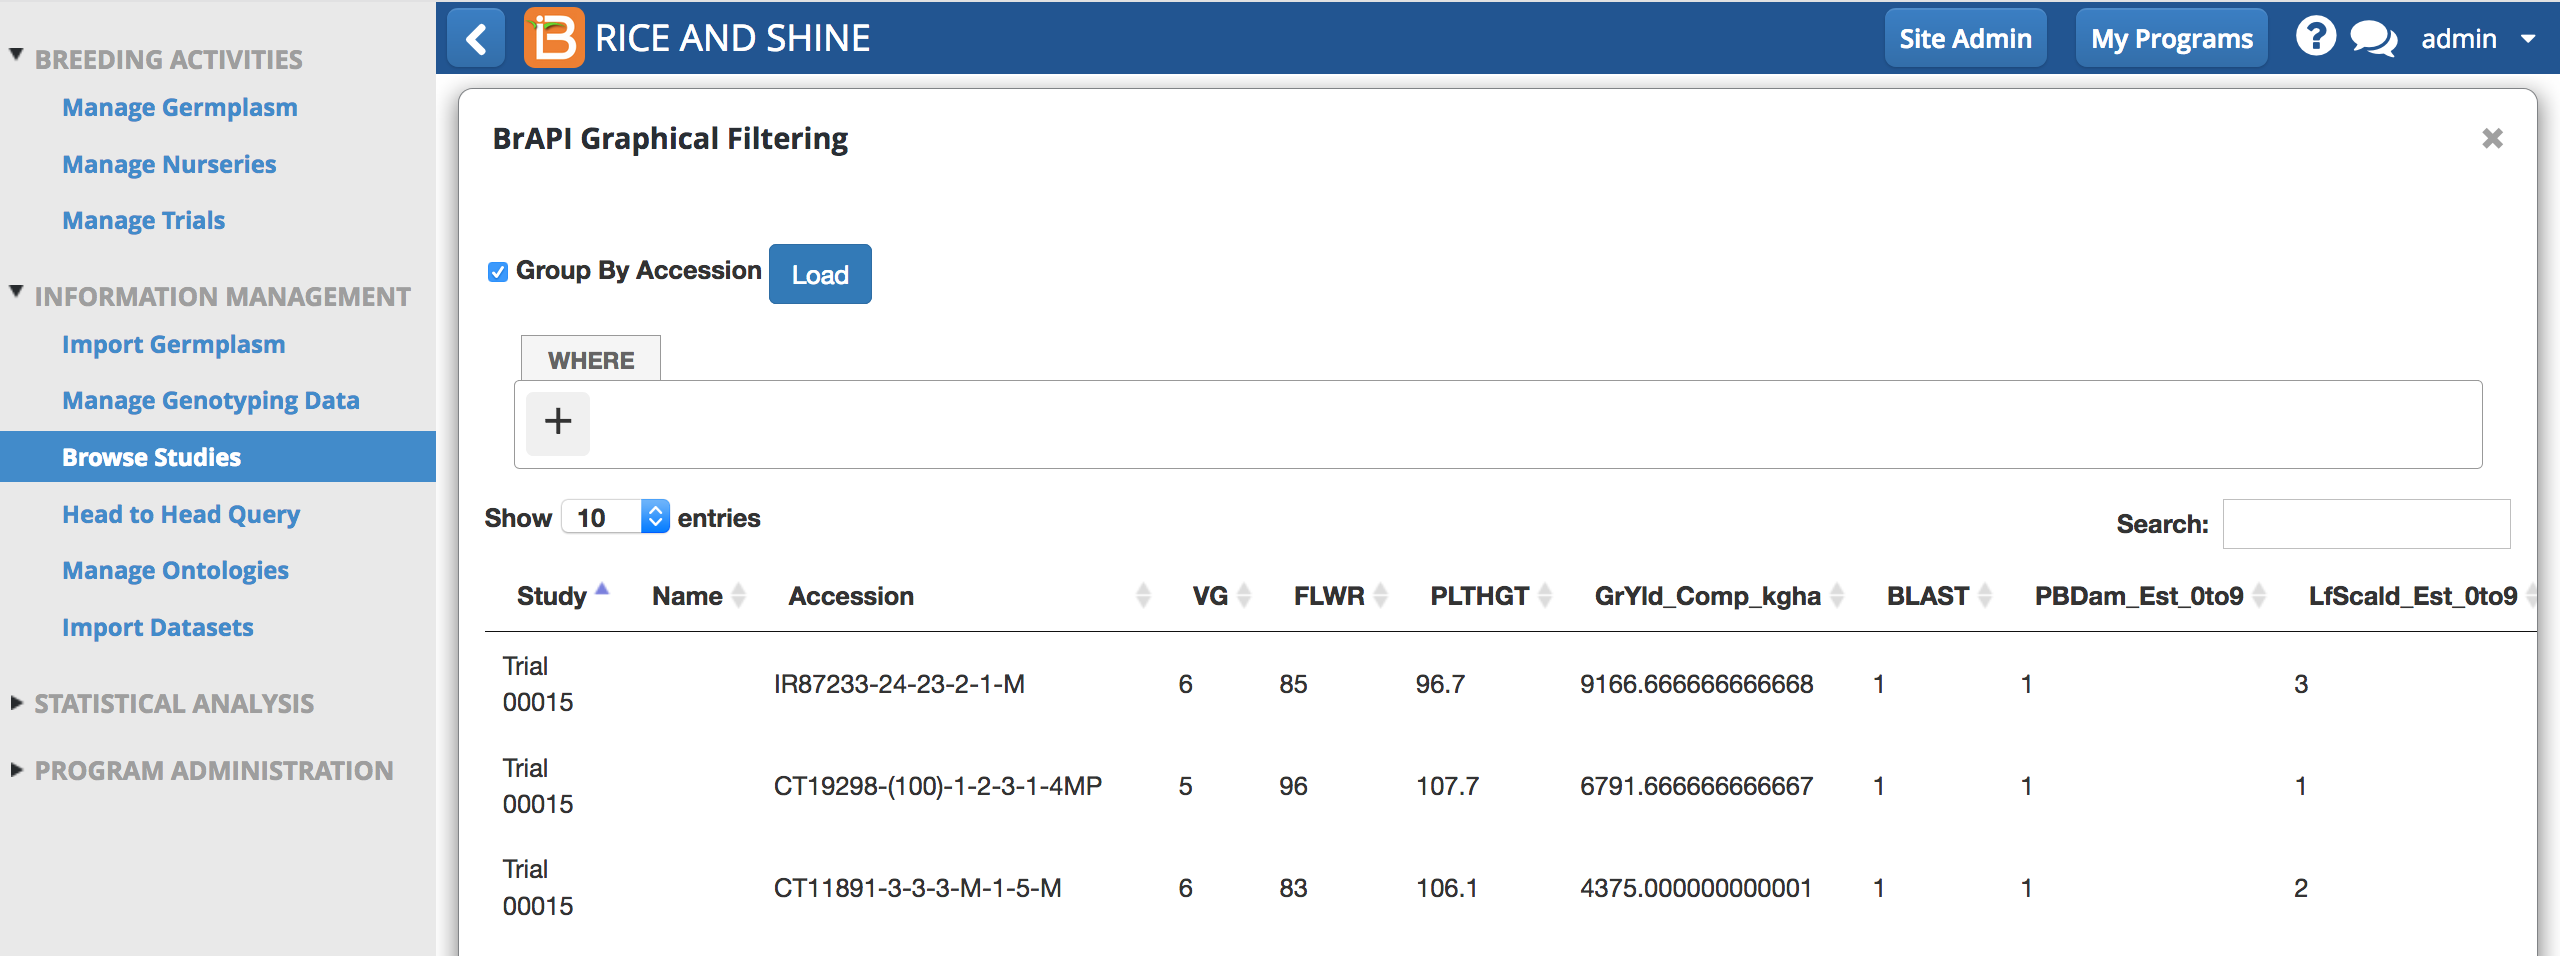
....

91 germplasm entries were evaluated wil several replications at the CIFOR location. Grouping by accession reveals the means of the traits evaluated fot each germplasm.
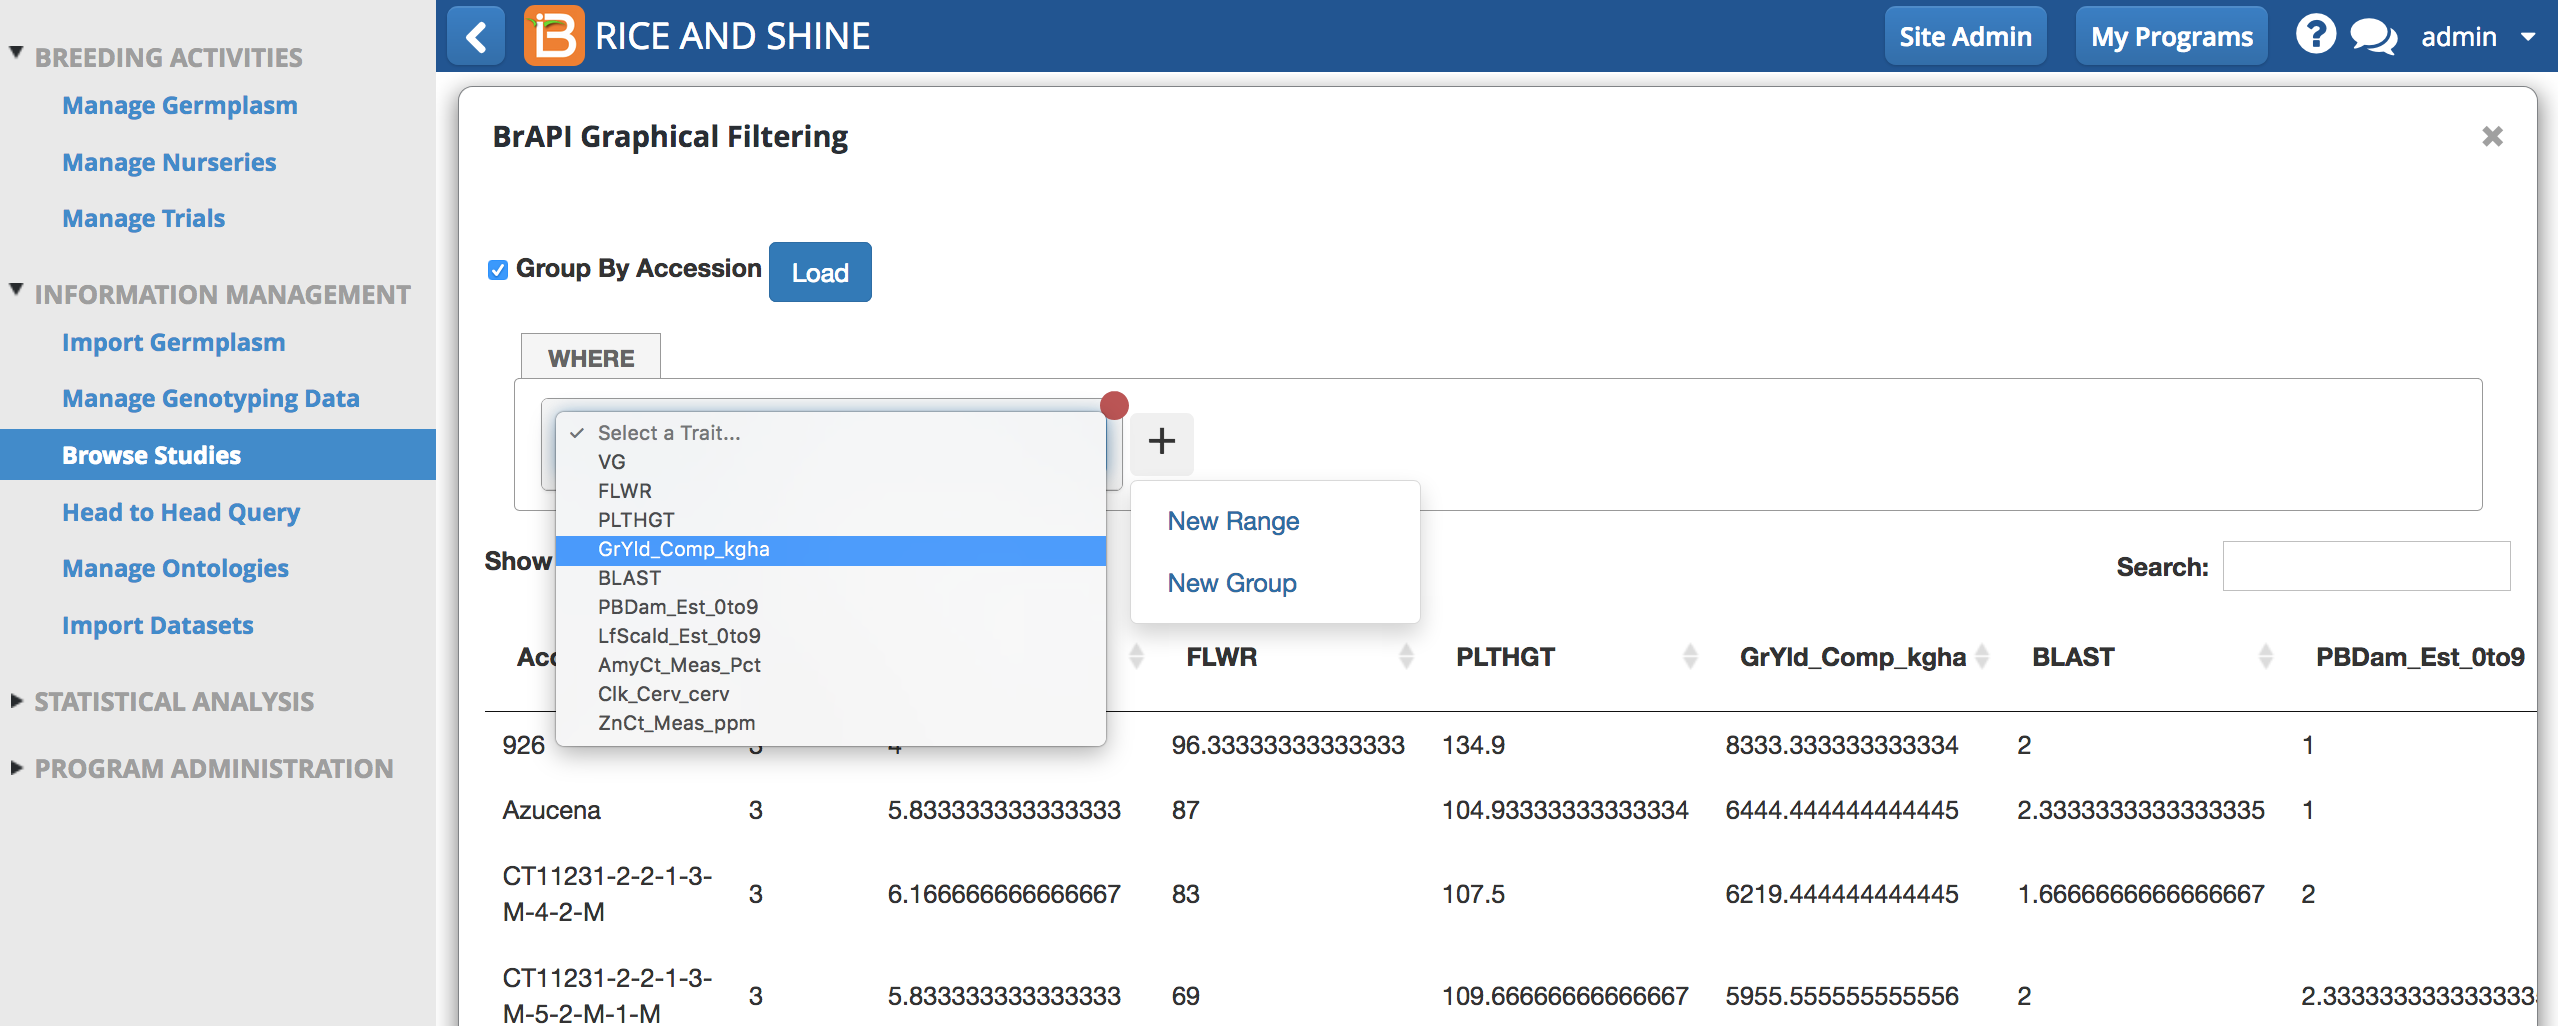
- Select the + button and New Range to reveal traits.
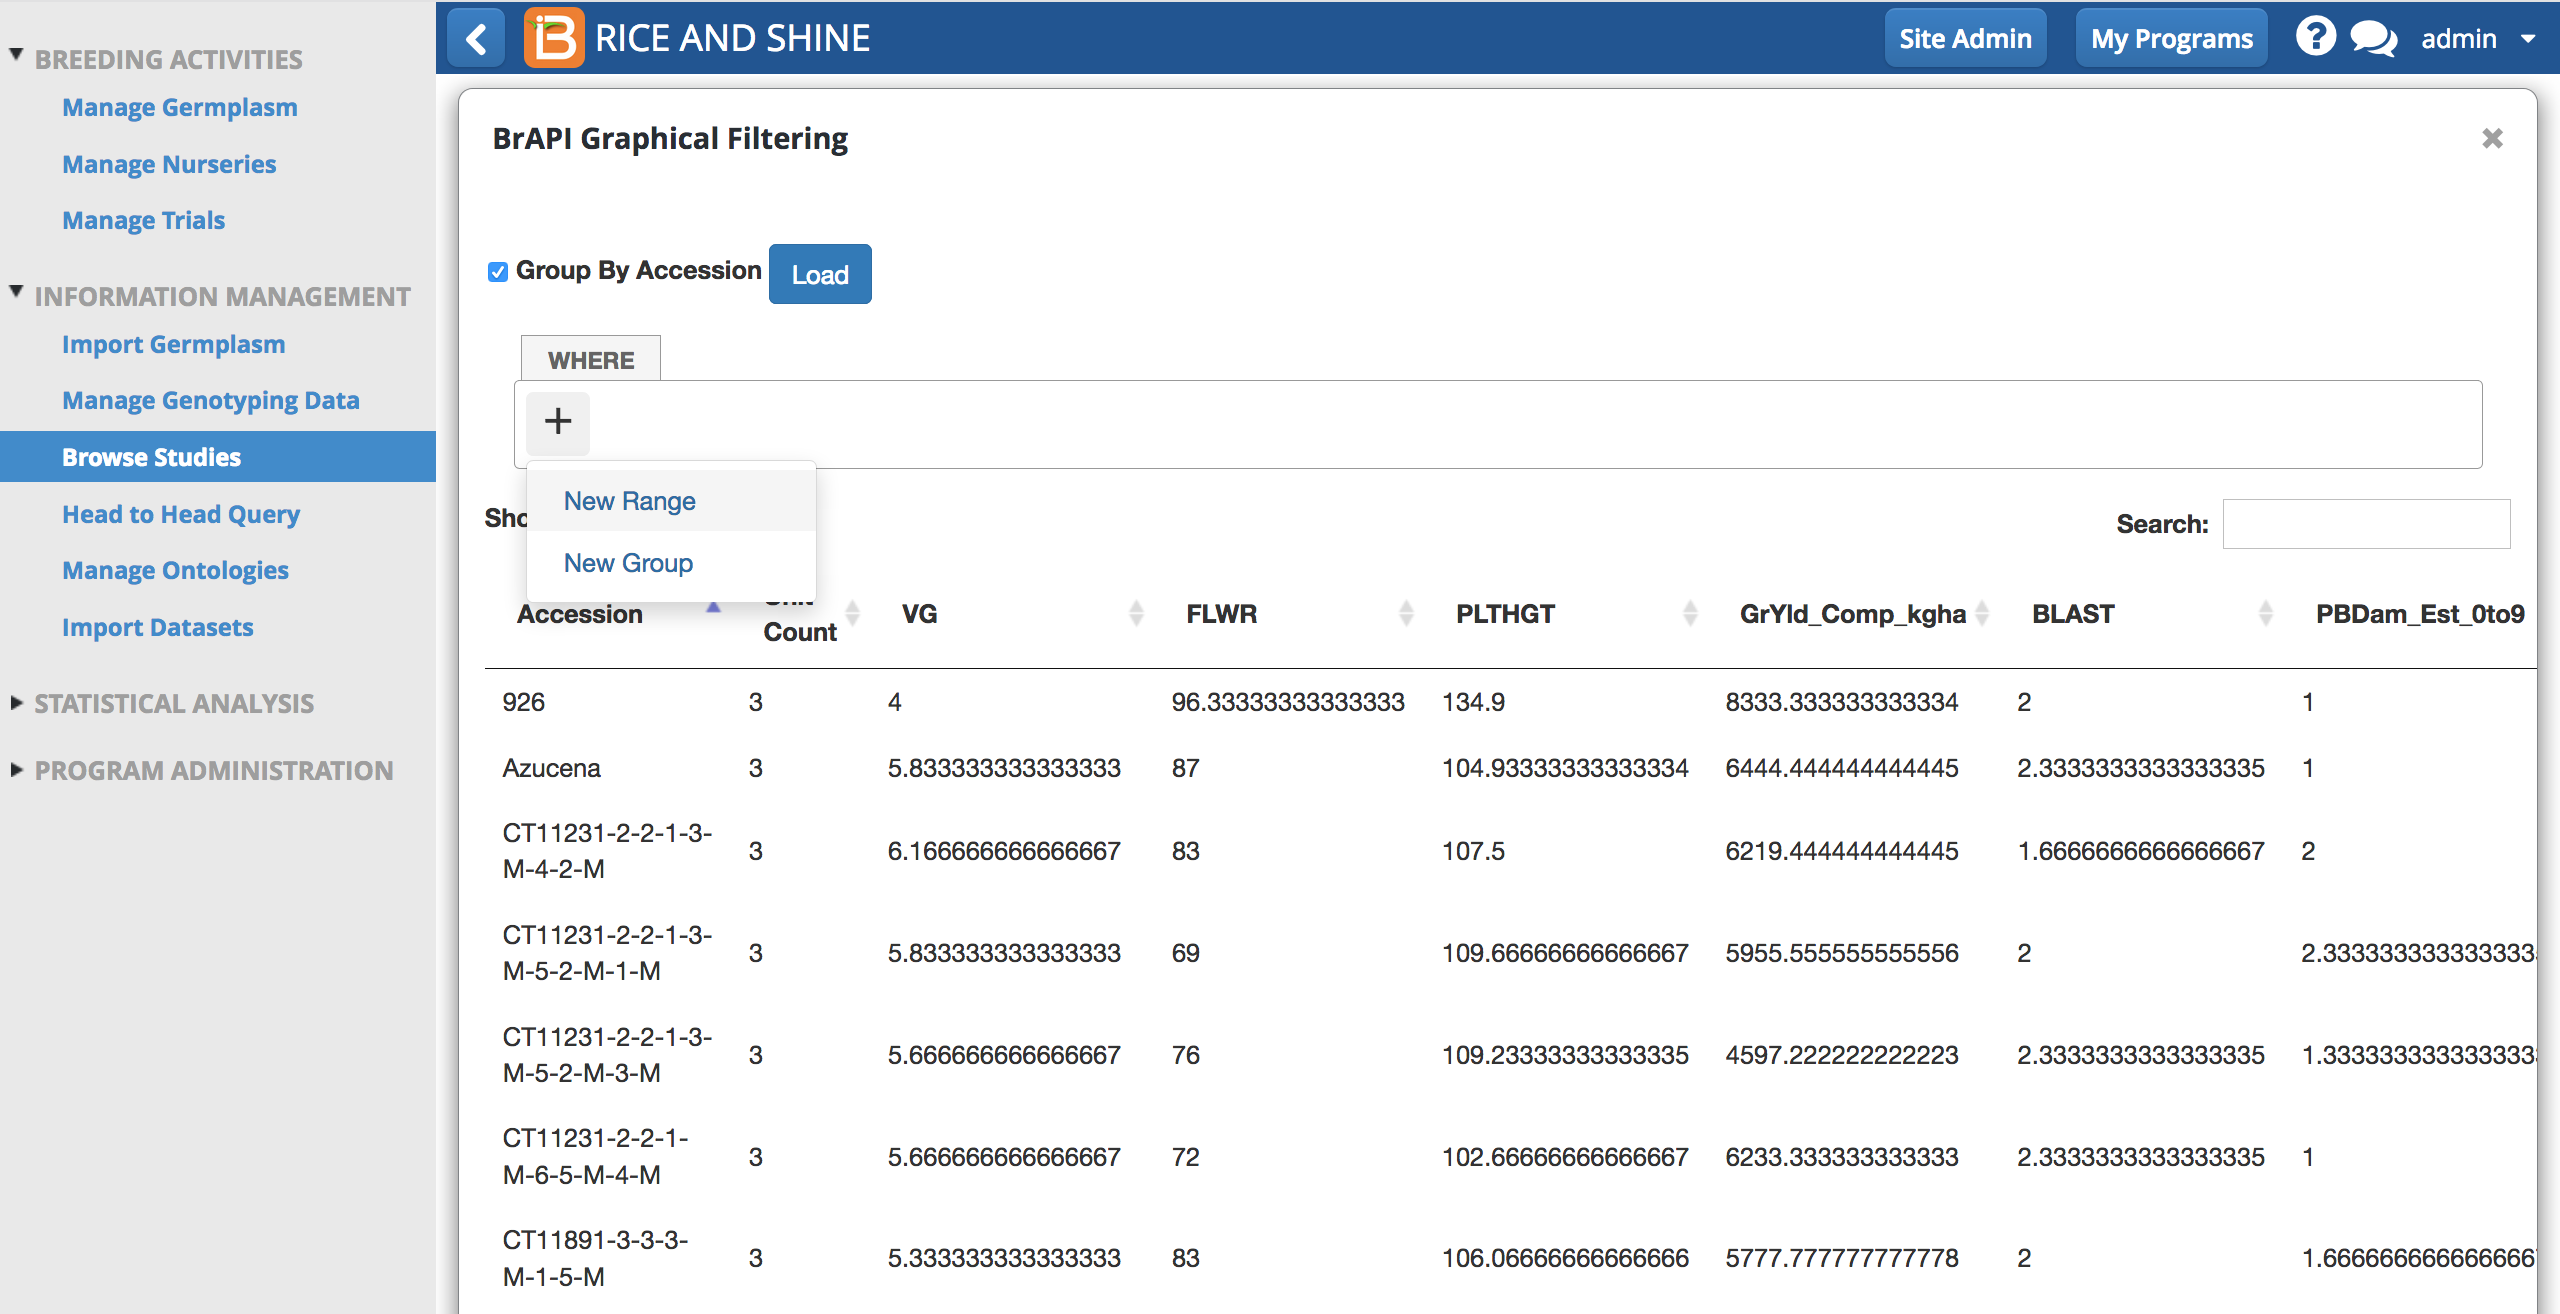
- Select trait to display in the graphical interface.
- Right click on the distribution graph to draw a box across the range of values to favor for selection. The list of germplasm below becomes restricted to display only those germplasm who performed in the desired range.
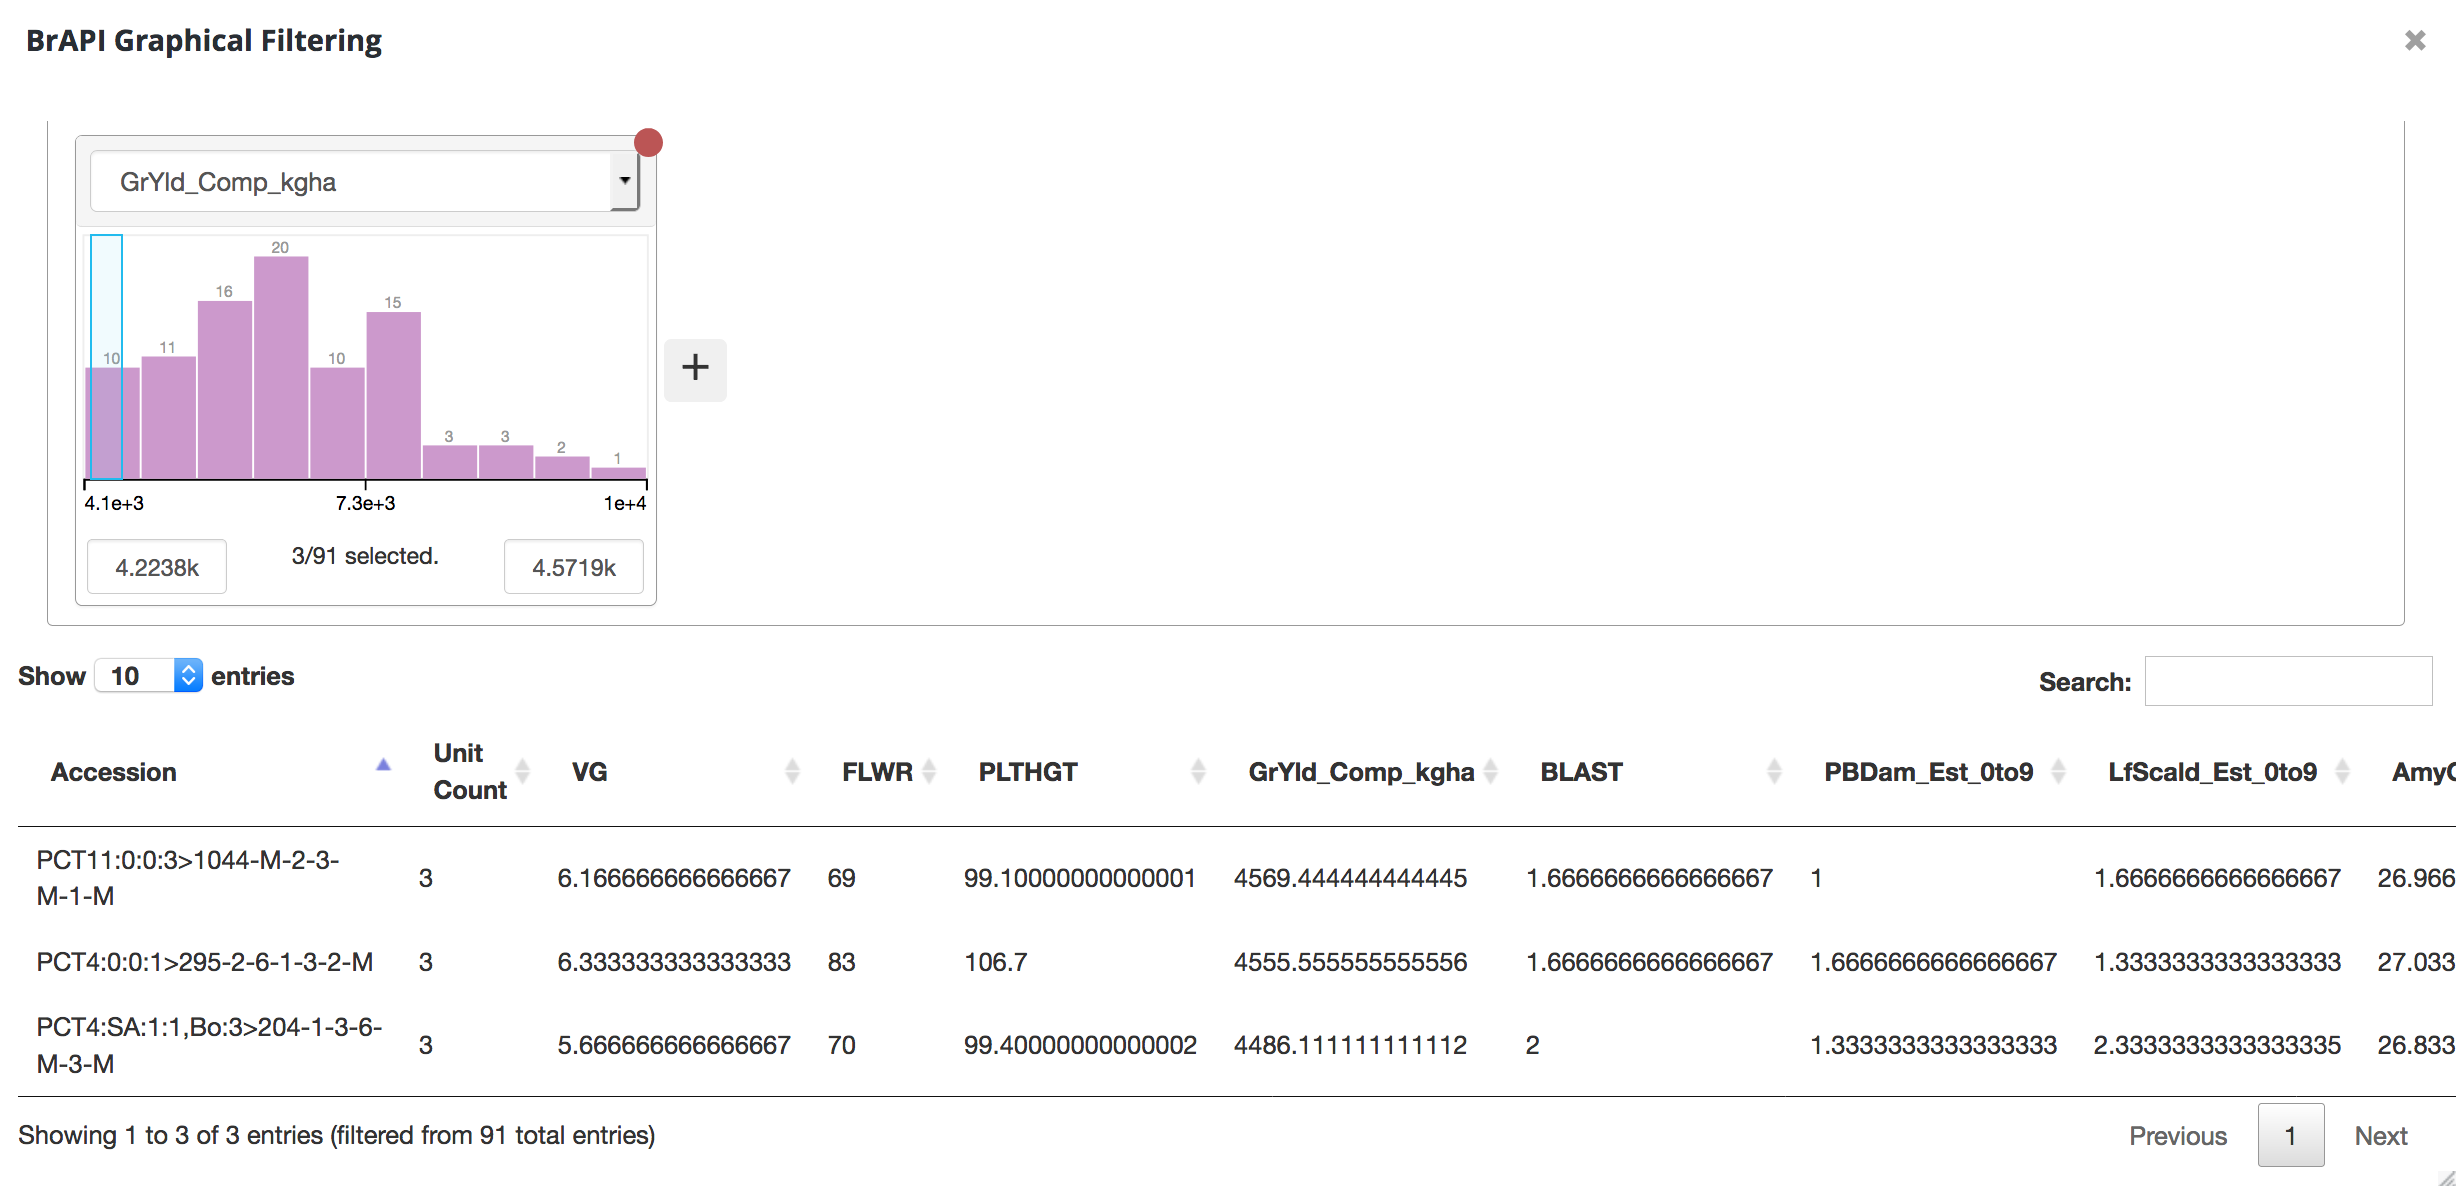
Three germplasm evaluated at the CIFOR location had mean yield measurements between 4223.8-4571.9 kilograms per hectare.
- Use the + button to add additional trait filters with the following qualifiers:
- And
- And Not
- Or
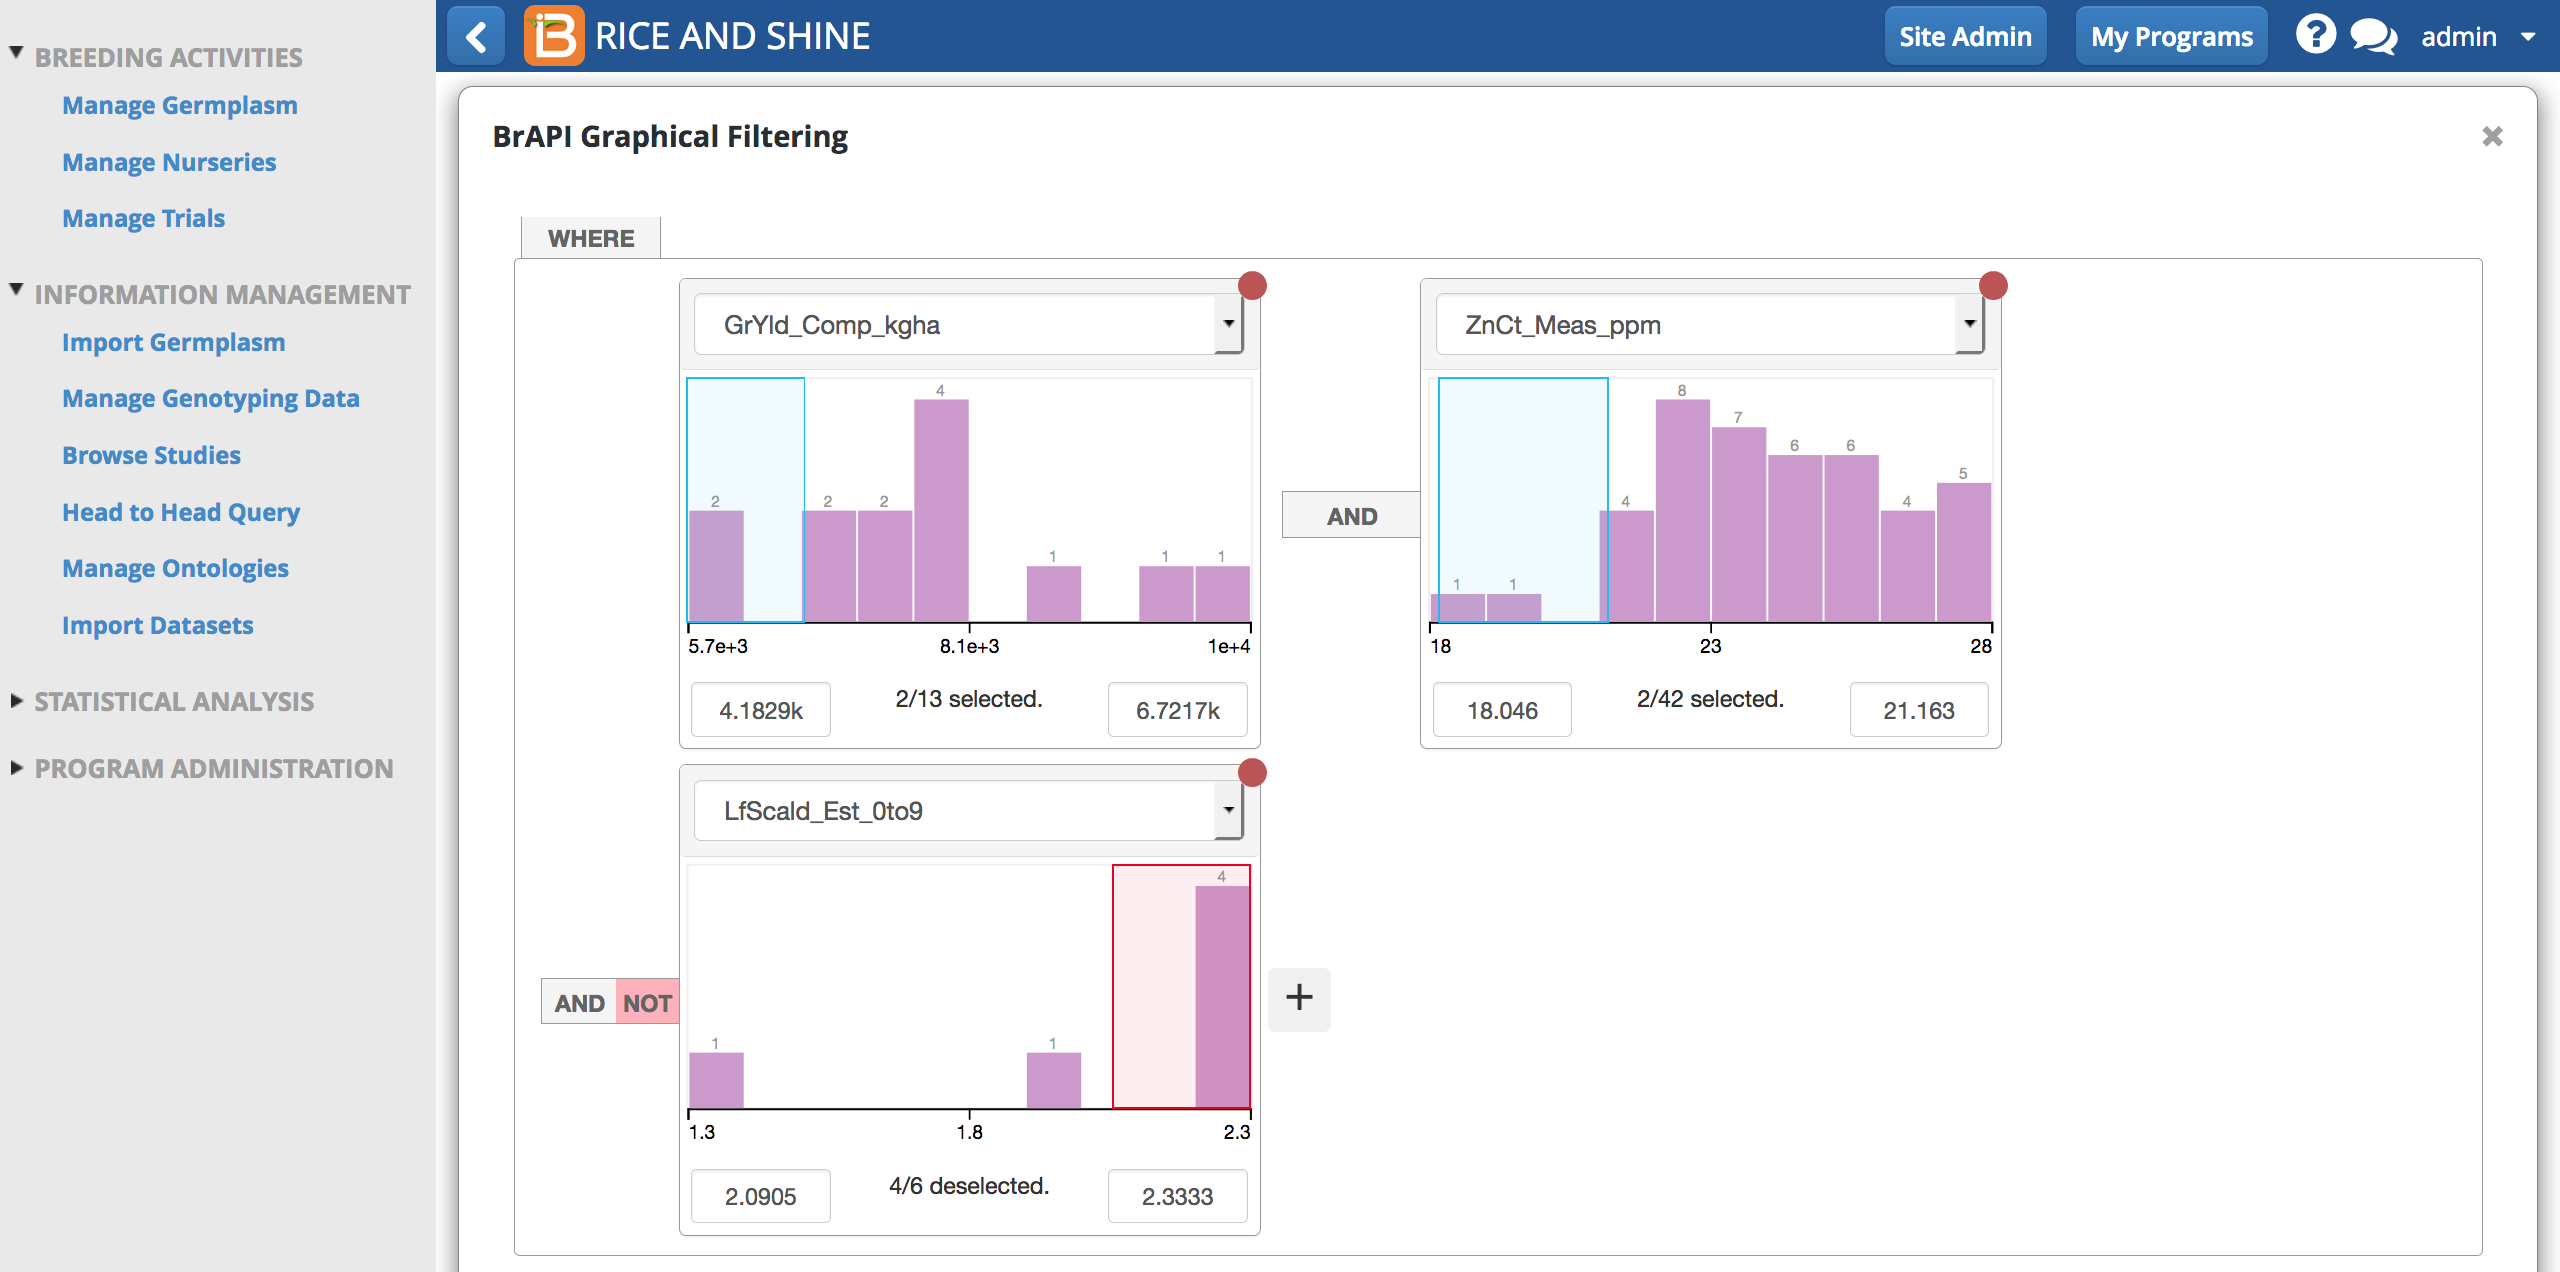
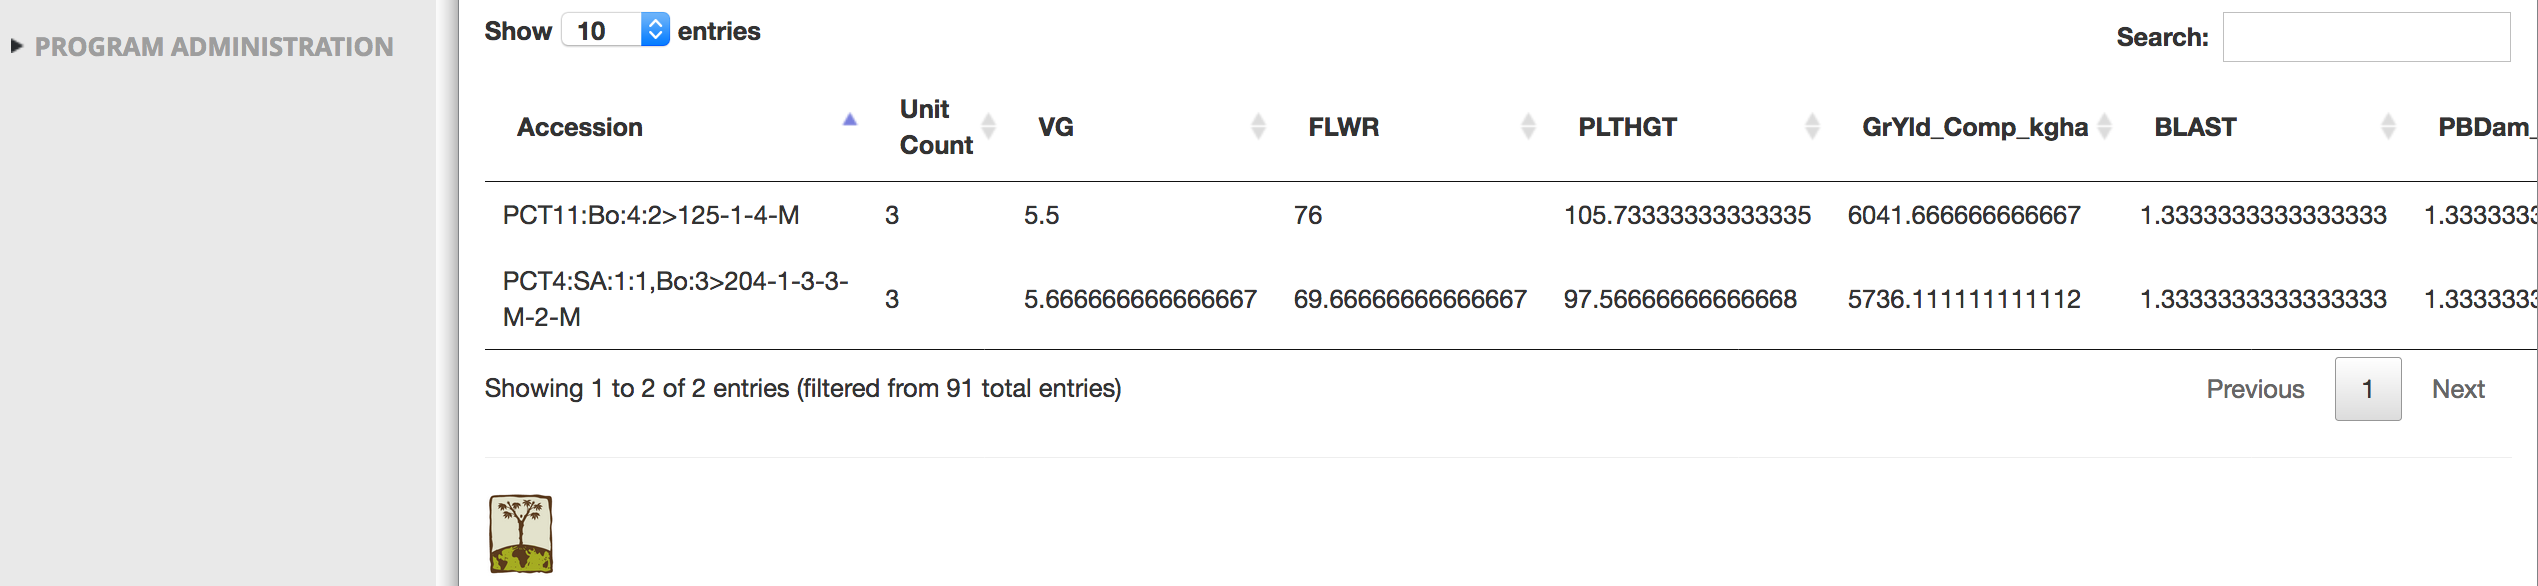
Two germplasm evaluated at the CIFOR location had mean grain yields a zinc levels high enough and leaf scald scores low enough to meet the filtering criteria.
Means Dataset
If single site analyses have been preformed for a study and the summary statistics loaded (see more Upload Summary Stats to BMS), the means data is available for review and export from Browse Studies.
- Select Means Dataset.
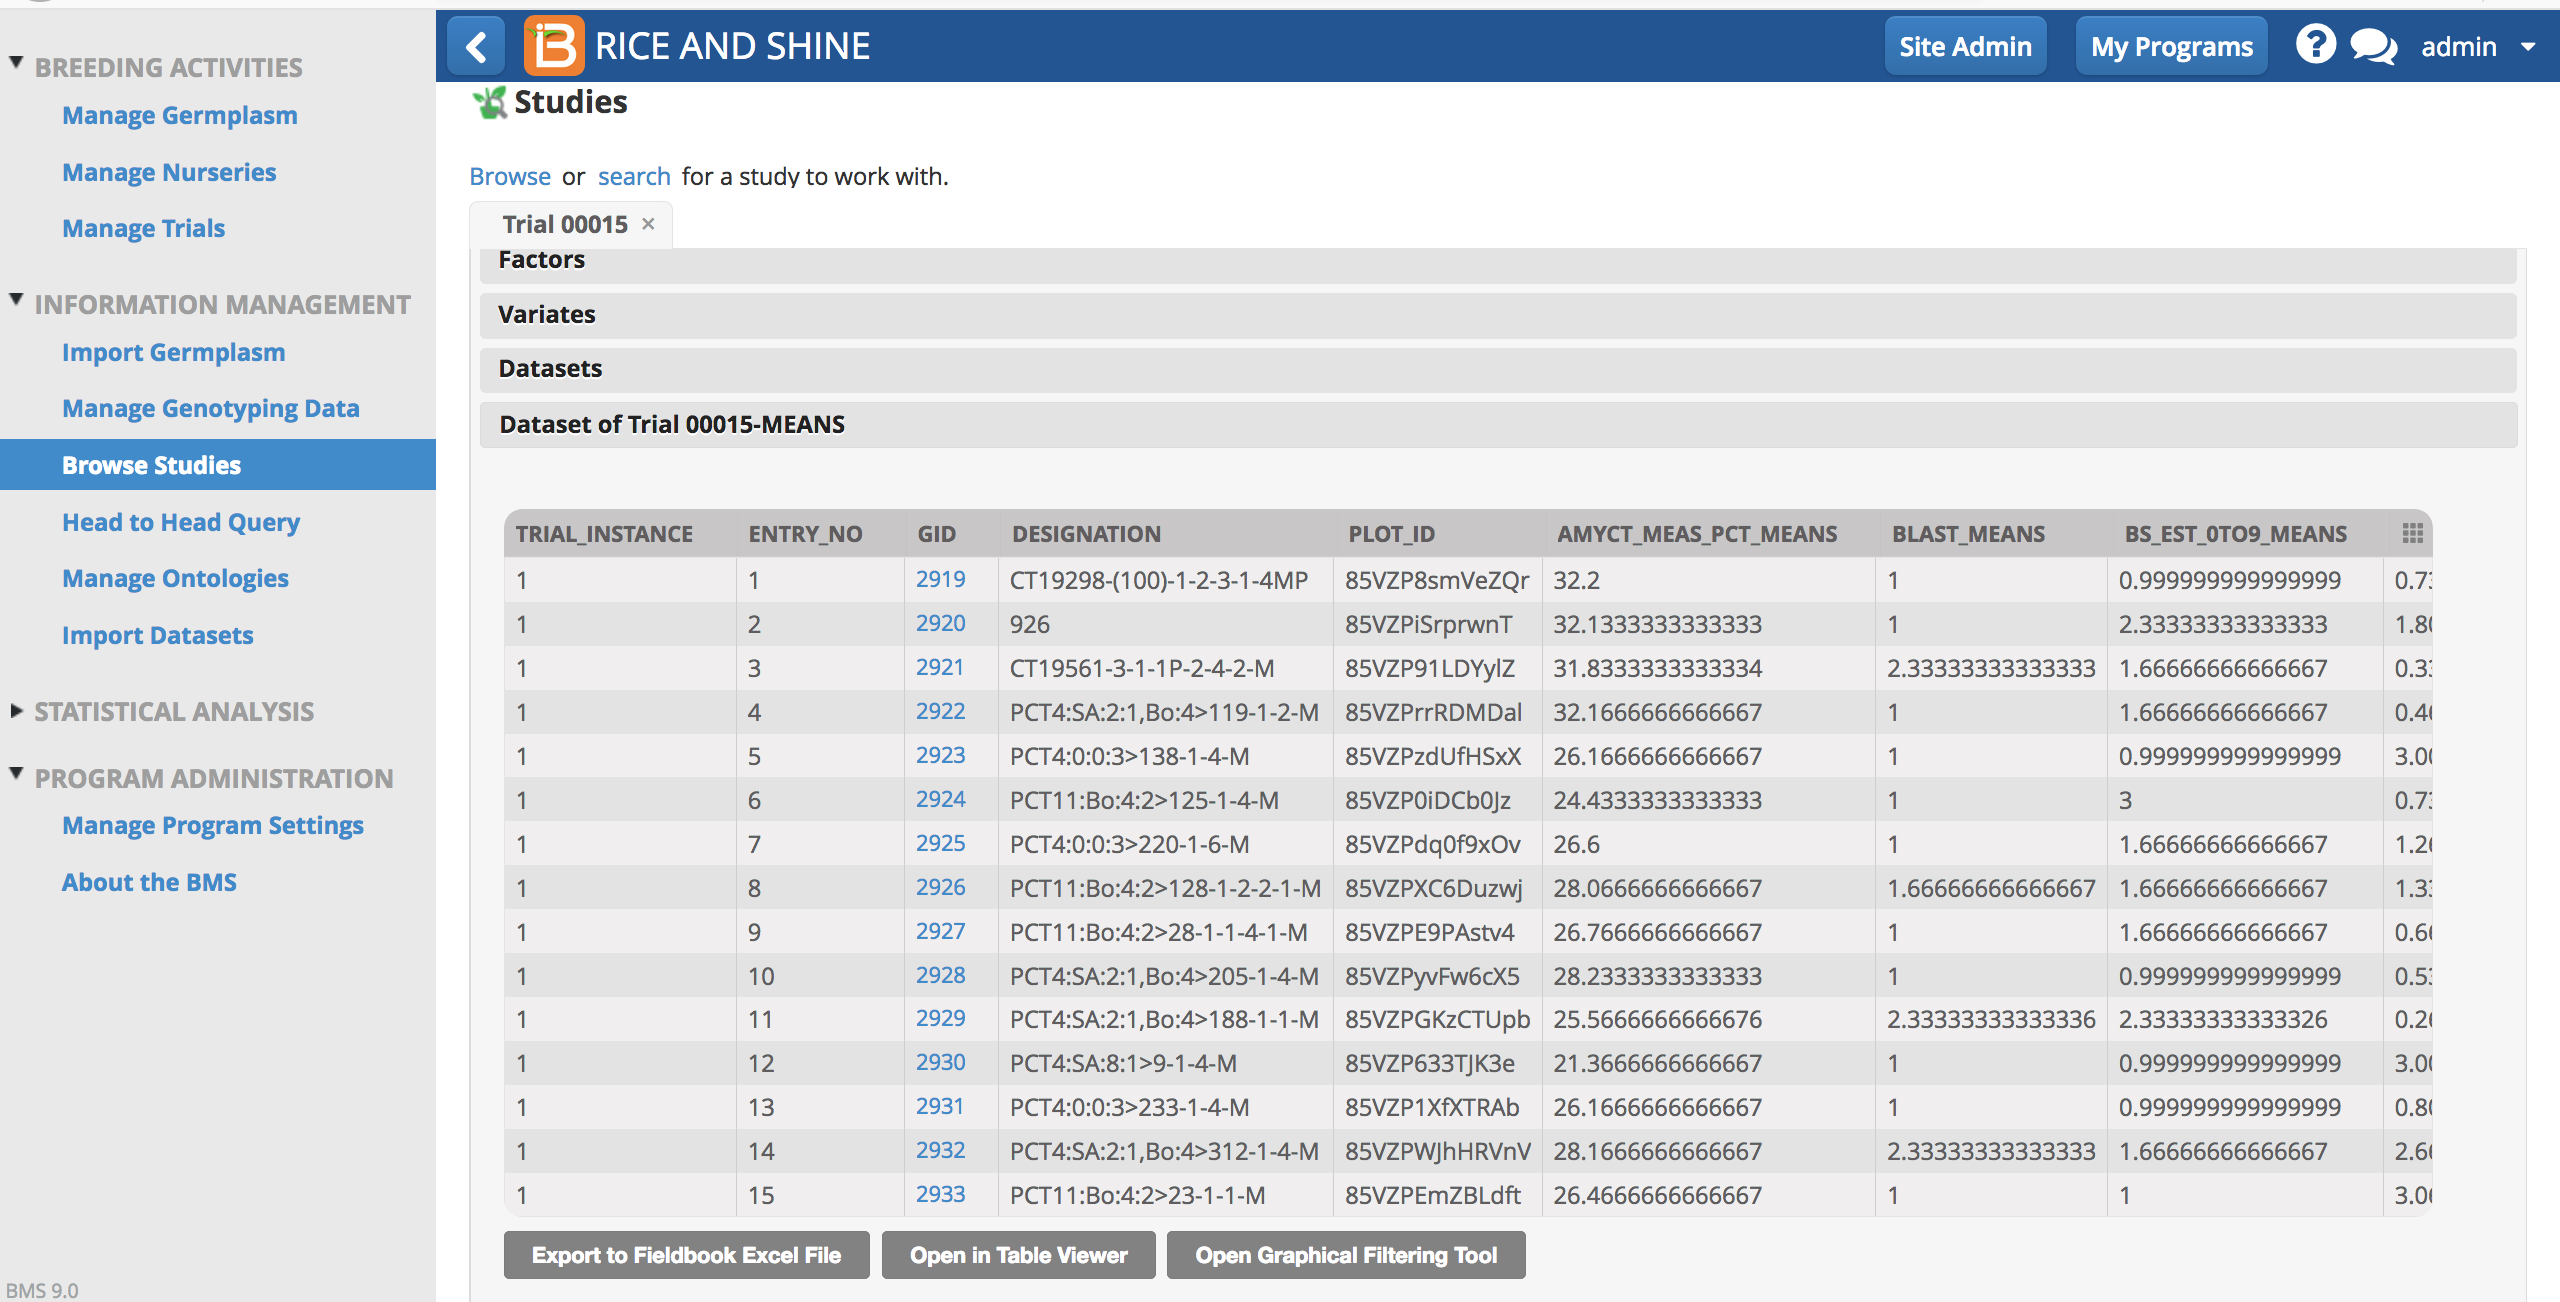
The means data set offers several options for review and export.
- Export the means data for all environments as an .xls file.
- Open in an expanded table view.
- Open in Graphical Filtering Tool by selecting one entry of an instance of interest
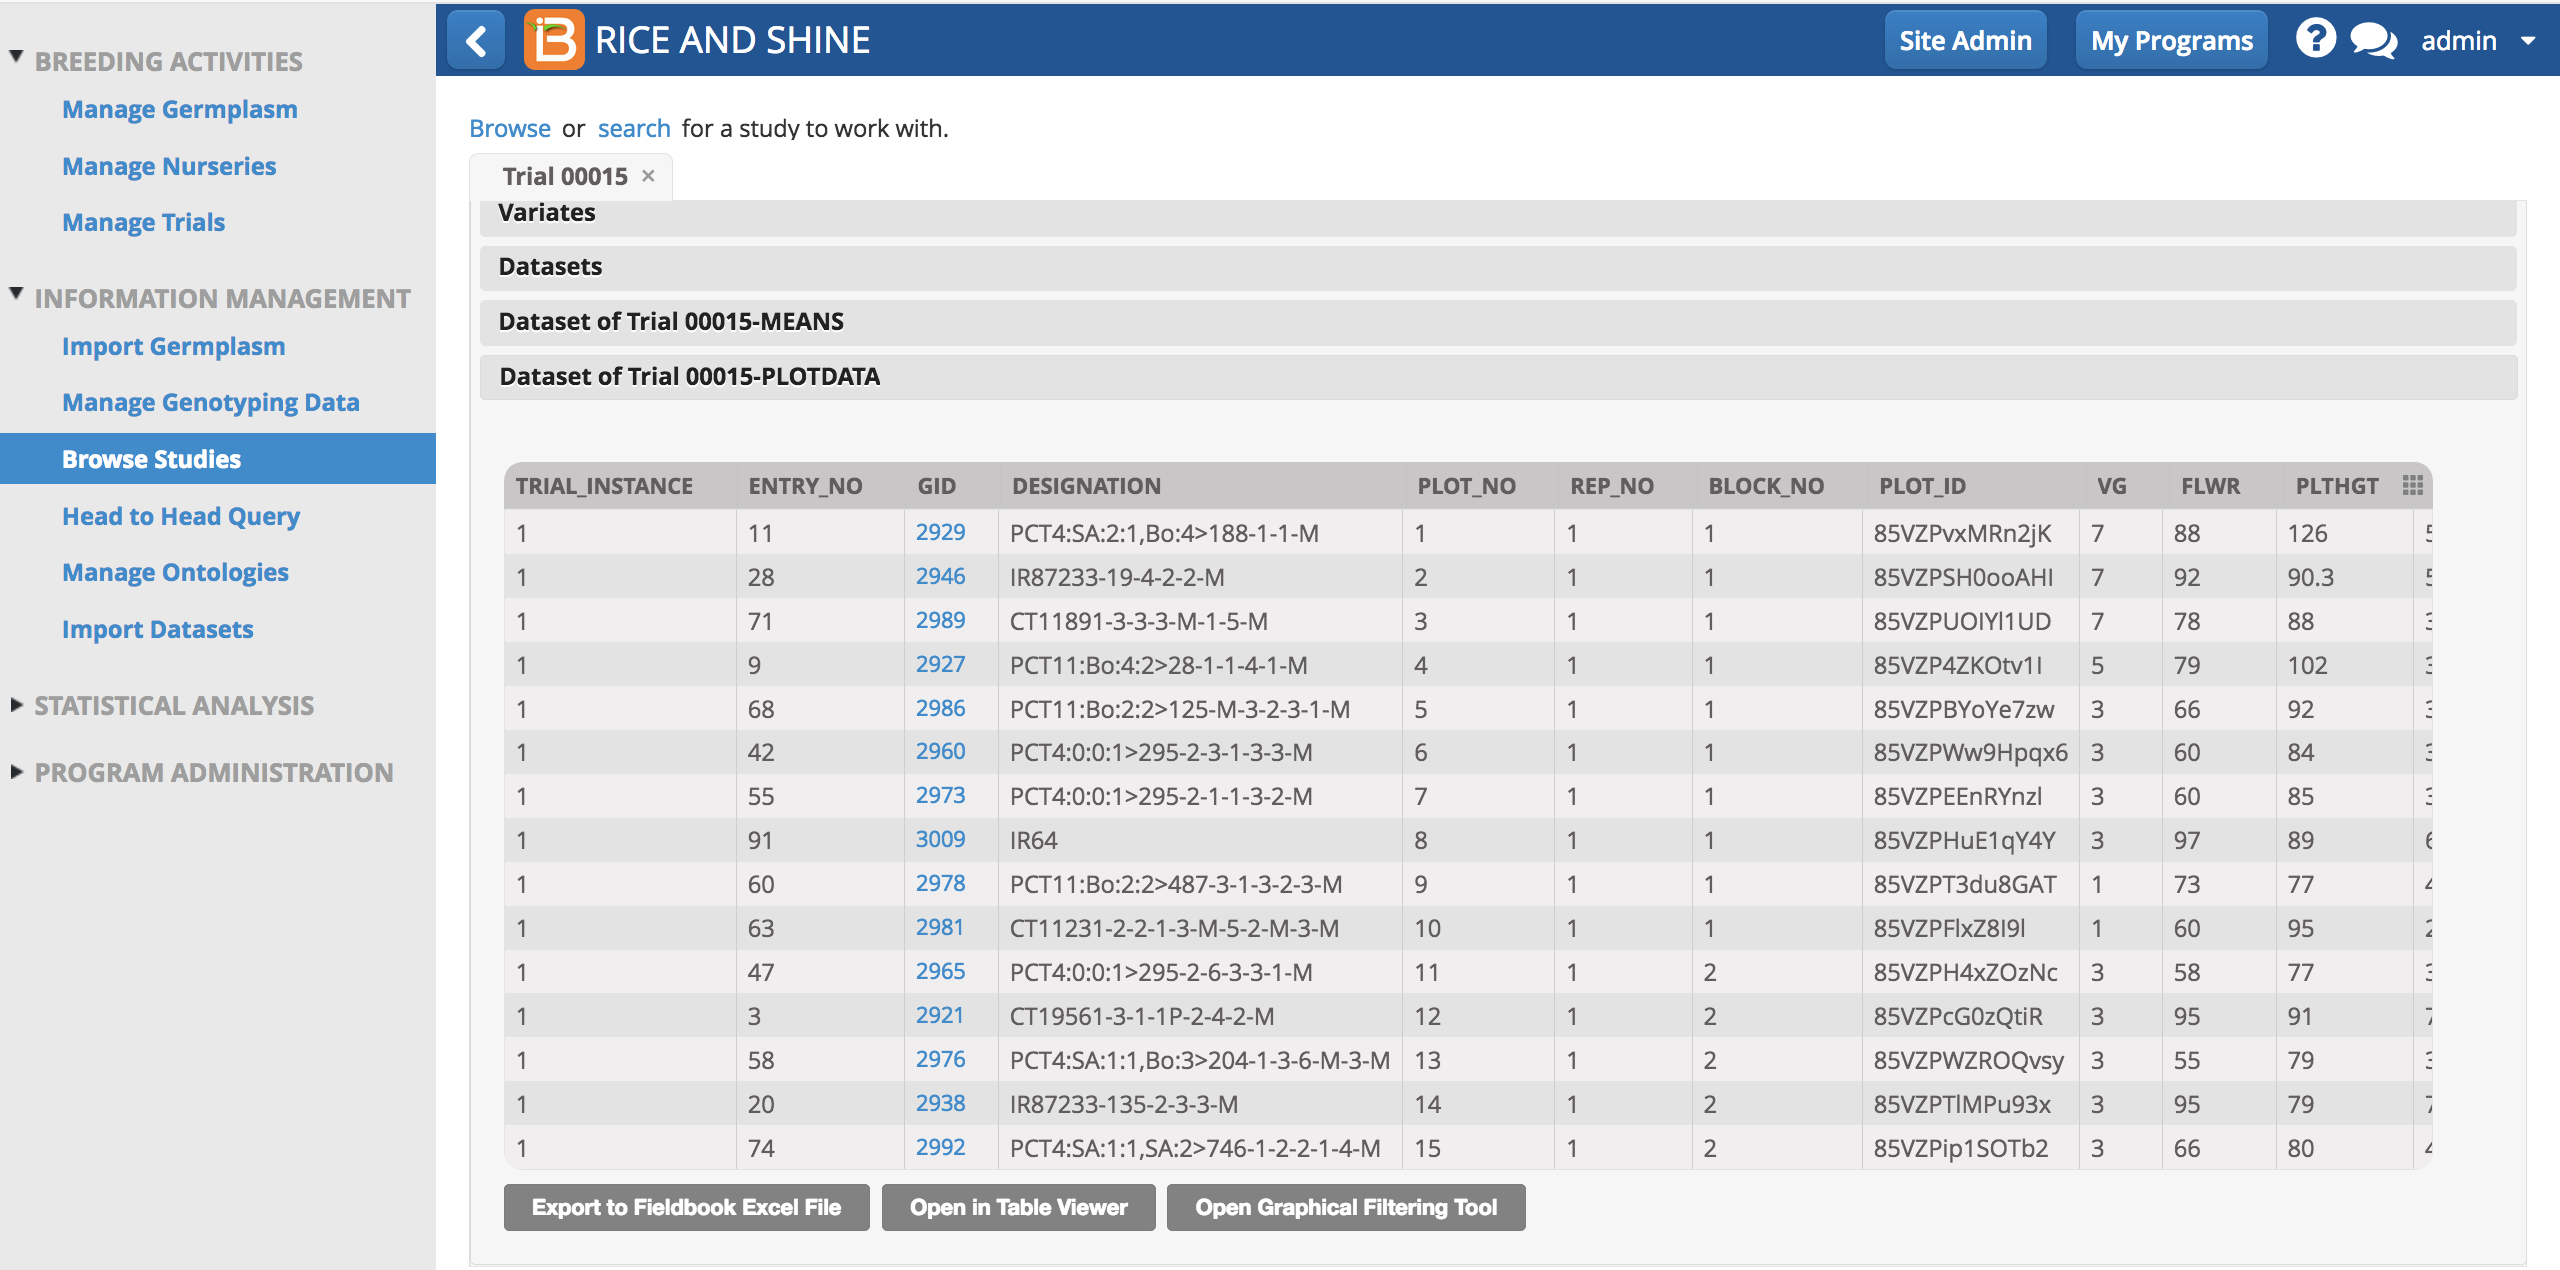
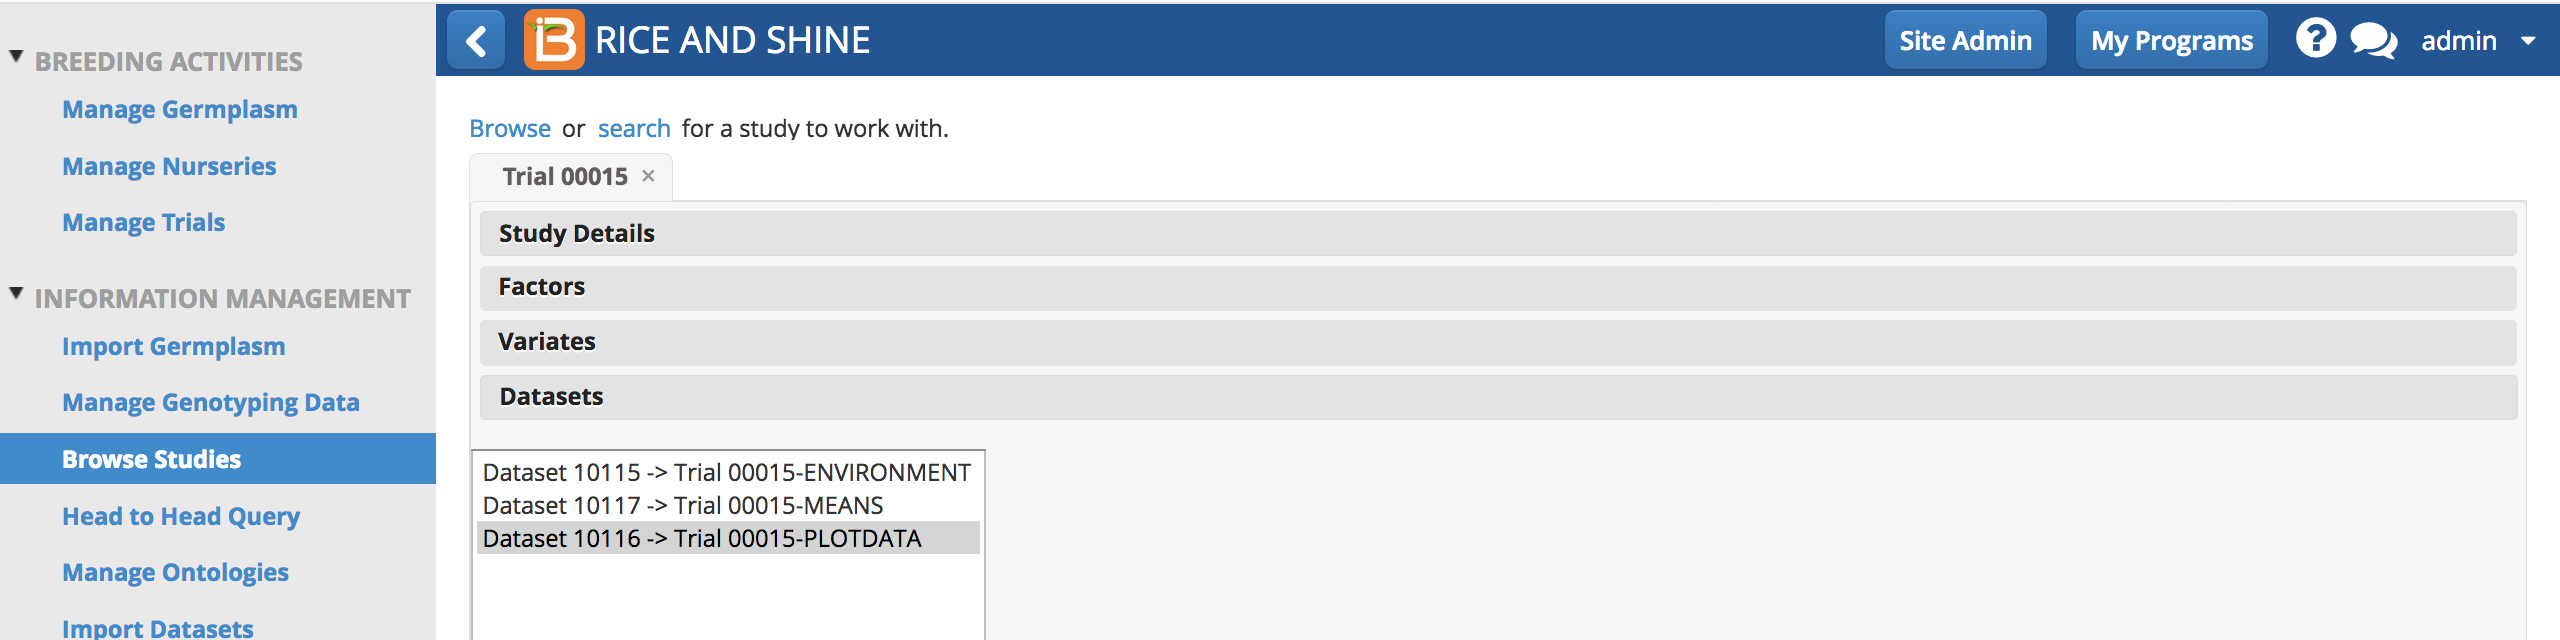
Plot Dataset
The plot dataset contains all the factors, variates, and observations for each plot.
- Select PLOTDATA.
- The plot data set offers several options for review and export.
- Export the entire plot datasets as an .xls file.
- Open in an expanded table view.
- Open in Graphical Filtering Tool by selecting one entry of an instance of interest